Every time the bond market sells off nervous investors fear that hyperinflation is right around the corner. It may well be that the dominant theme through this decade will prove to be rising inflation as the monetary chickens come home to roost but for the time being we prefer to agree with the following point of view:
Jan. 3 (Bloomberg) — The worst performance by Treasuries since the second quarter of 2009 reflects prospects for faster U.S. economic growth rather than concern that rising budget deficits will drive investors away from government debt.
The point is that rising yields are still, more or less, a cyclical positive.
Below is our chart of the S&P 500 Index compared to the spread or difference between 30-year and 10-year U.S. Treasury yields. Since it is still too early in the new quarter and year to get a sense of potential trend changes we are going to return to a topic that we have been following over the past few months.
The argument is that a ‘bear market’ begins with a low or negative yield spread and runs through until the yield spread reaches a peak. By extension this means that a ‘bull market’ begins in earnest when the yield spread finally turns lower and continues until the spread reaches a cycle bottom and swings back to the upside.
The good news is that improved prospects for U.S. economic growth are pulling the yield spread lower which, in turn, is helping to push the S&P 500 Index upwards. The bad news might well be that even in a bull market prices tend to correct or consolidate from time to time.
On the chart we have added a ‘box’ around the SPX in early 2004. Our sense is that in due course the SPX is going to get far enough above its moving average lines to initiate a correction. Our focus on today’s second page will be contrasting the current situation with this particular time period.
Aside from that situation still appears to be quite positive. If the markets repeat the previous trend the argument would be that the bull market will continue on a broad basis until the yield spread declines to the ‘0’ line and then eventually swings higher in response to the next wave of economic weakness.
Equity/Bond Markets
The chart below compares the S&P 500 Index with… the ratio between copper futures and 10-year Treasury yields and… the sum of 3-month and 10-year Treasury yields from late 2003 through 2004.
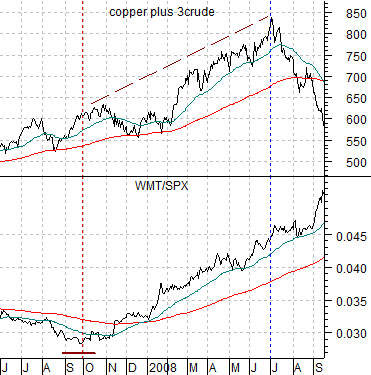
On occasion we have shown the gold miners (XAU) and the copper/10-year yields ratio to make the point that AFTER the copper/yields ratio peaks and turns lower the gold mining stocks tend to correct lower in price.
The argument actually extends to the broader market. In this instance we are attempting to show how the SPX shifted into price consolidation for close to 9 months during 2004. The intermarket argument was that the combination of rising yields (the sum of 3-month and 10-year yields rose above the moving average lines) and copper/yields ratio declining shifted the SPX into a period of price correction.
Now… compare this with the current situation shown below right.
Notice that yields have started to rise with the sum of short and long-term Treasury yields now above the moving average lines. At the same time yields have been rising faster than copper prices which has pulled the copper/yields ratio somewhat lower.
The major difference between the present time period and 2004 is that the SPX is still making new recovery highs.
This brings us to our next thought. Below is a comparison between the SPX in 2004 and the Hang Seng Index from Hong Kong for the current time frame. Our speculative thought is that it might be possible that the Hang Seng Index is the market working through a consolidation this time around. It began to sell off as yields started to rise last November which seems somewhat similar to the SPX in March of 2004. Keeping in mind that a weaker Hang Seng Index tends to lead to dollar strength we will have to keep a close eye on the dollar as the quarter progresses.