There were a few developments within the markets that caught our attention over the past day. The equity markets were somewhat weaker in Asia, for example, while copper prices fell close to the lowest levels in two weeks. Wal Mart’s stock price finally climbed above 55 (WMT tends to trade flat unless there is some kind of weakness brewing for the Asia/commodity theme) while the major U.S. banks managed to strengthen some what after early weakness. The Canadian banks are still trending higher while the Japanese banks remain… uninspired.
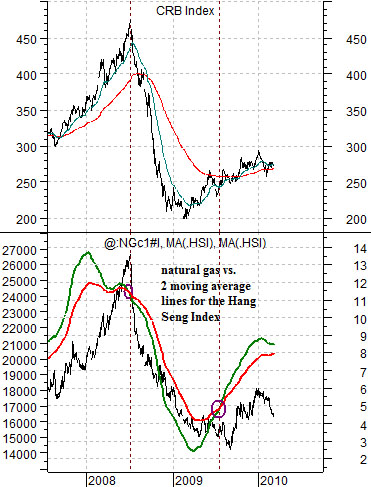
We often lump Asian growth in with the trend for commodity prices so we thought we would start off today by returning to a chart comparison that helps- we hope- explain what we are referring to. At right is a chart of the CRB Index as well as an overlaid chart of natural gas futures (in black) and two moving average lines for the Hang Seng Index from Hong Kong.
The argument is that the Hang Seng Index ‘leads’ the commodity markets in general and natural gas prices in particular. To smooth out the trend we have distilled the Hang Seng down to the 100-day e.m.a. line (green) and 200-day e.m.a. (red).
The issue isn’t whether the Hang Seng has bottomed or peaked but rather the position of the two moving average lines. When the lines ‘cross’ to the upside it suggests that the trend for natural gas prices is positive. When the lines ‘cross’ to the down side the trend then turns negative.
The Hang Seng Index peaked in the autumn of 2007 but the moving average lines did not ‘cross’ to the down side until the end of the second quarter in 2008. Coincidentally or not… this was the exact start of rather intense pressure on commodity prices.
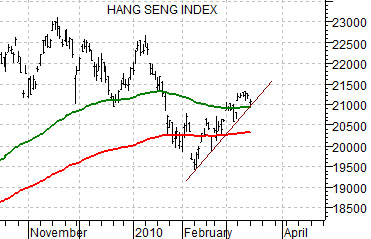
If commodity prices tend to trend with Asian growth and equity markets tend to lead economic activity then this comparison actually makes a bit of sense. If the Hang Seng Index weakens to the point where the moving average lines ‘cross’ then our view is that Asian growth- and the real or perceived demand for raw materials- is slowing. So where do things stand at present? The chart below right shows that the Hang Seng Index would likely have to break back below 19,500 over the next few months before there would be much in the way of imminent risk of a moving average cross over.
Equity/Bond Markets
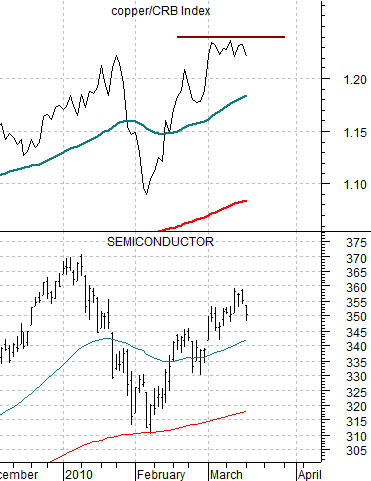
At right is a comparison between the ratio of copper futures to the CRB Index and the Philadelphia Semiconductor Index (SOX).
On page 1 we suggested that it would take something south of 19,500 by the Hang Seng Index to turn the cyclical trend that tends to govern commodity prices negative. In past issues we have also argued that the markets have tended to include a fairly strong cyclical ‘push’ in between the peak for the copper/CRB Index ratio and the ‘cross’ down through the 200-day e.m.a. by the 50-day e.m.a.
While this may seem overly complicated (and it probably is) the idea is that a strong copper/CRB Index ratio tends to funnel money into the mining sector but as long as the ratio is not overly weak money tends to migrate into other themes once the ratio stops rising. When the dollar is weaker a top for the ratio will tend to mark the start of strength in grains prices while a stronger dollar will tend to favor the tech stocks.
Our point is that if the copper/CRB Index ratio finally reached a top in early March then the markets may be ready to rotate into one of the two themes mentioned above.
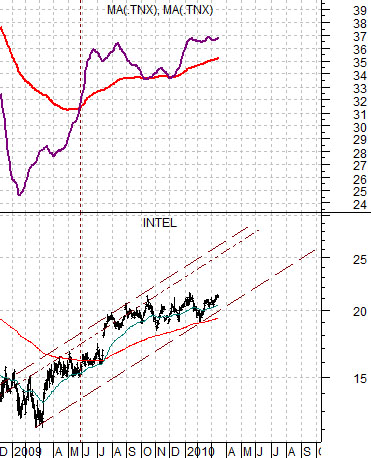
Below are two charts of Intel (INTC) along with two moving average lines taken from the chart of 10-year U.S. Treasury yields.
In general the cyclical trend is positive as long as the moving average lines do not cross to the down side. The chart below shows that this happened in the middle of 2000 as falling bond yields preceded the slow down in economic activity that eventually caught up with the tech sector later that year. At present (below right) the trend is still positive with 10-year yields last seen at 3.70%.