We are going to return to an idea that we haven’t dealt with for a number of months. The argument is that there is a basic and recurring relationship between the trend for Hong Kong’s Hang Seng Index and the CRB Index.
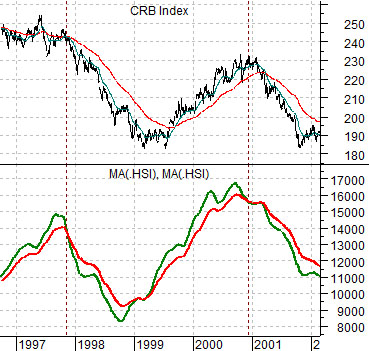
Below is a chart comparison between the CRB Index and the Hang Seng Index. The Hang Seng Index has been reduced to two moving average lines- the 100-day e.m.a. in green and the 200-day e.m.a. in red.
The chart covers the time period between late 1996 and early 2002. It includes the peaks for the commodities markets in 1997 and late 2000.
Our recurring argument is that the CRB Index remains positive as long as the 100-day e.m.a. line for the Hang Seng Index remains above the 200-day e.m.a line. In other words when the green line is higher than the red line the underlying trend for raw materials is positive. This is based on the premises that strong Asian growth (i.e. a rising Hang Seng Index) reflects expanding demand for raw materials and the observation that in most instances equity prices tend to lead conditions in the real world.
The moving averages ‘crossed’ to the down side in late 1997 following the ‘crash’ of the Hang Seng Index in the third quarter of that year. The CRB Index turned bearish into early 1999. The moving average lines ‘crossed’ once again right at the end of 2000 in front of the final peak for the CRB Index and only a month or so in front of the first rate cut by the Federal Reserve following the melt down of the Nasdaq.
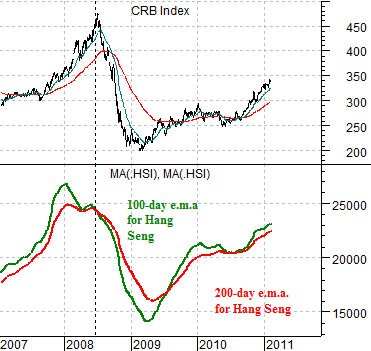
Next we show the same comparison starting in early 2007.
Once again the moving average lines ‘crossed’ right at the peak for the CRB Index. While the Hang Seng Index began to decline during the final quarter of 2007 the moving average lines did not converge until the final week of June the following year. This preceded the start of commodity price weakness by a matter of days.
The point is that it will take either considerable near-term weakness or a fairly lengthy period of time to pull the 100-day e.m.a. line back below the 200-day. In the mean time the trend for the CRB Index is expected to remain no worse than neutral.
Equity/Bond Markets
Above we focused on the ‘crossing’ of the two moving average lines for the Hang Seng Index. Lost in the details is the fairly simple point that the moving average lines are not going to ‘cross’ until the Hang Seng Index has declined some distance or for some time below the 200-day e.m.a. line.
So… with China tightening credit and the markets running on the same basic trend that created the financial markets melt down in 2008… what would a ‘top’ for the Hang Seng Index look like?
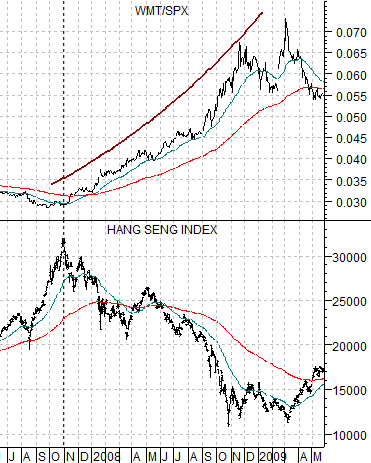
Below is a comparison from 2007 into early 2009. The chart shows the Hang Seng Index and the ratio between Wal Mart (WMT) and the S&P 500 Index (SPX).
It is our view- for good or for bad- that Wal Mart is an important stock. WMT tends to trend somewhat aimlessly during periods of strong Asian and commodity price growth so any time it begins to rise relative to the S&P 500 Index our interest is piqued.
By way of explanation money is always moving into, out of, and within the markets in search of either growth or safety. When the BRIC-type theme is strong money tends to move into the various global nooks and crannies while concentrating within the U.S. market on higher growth and valuation names. In other words you will tend to see within the retail space better price action for Amazon and Target compared to stodgy old Wal Mart.
The chart shows that as the Hang Seng Index reached a price peak in the autumn of 2007 the ratio between Wal Mart and the SPX began to rise. This reflected- in our view- the start of the shift by money away from growth and risk and back towards stable and safe.
The upward swing in the WMT/SPX ratio occurred almost nine months ahead of the collapse by the CRB Index that corresponded with the ‘crossing’ of the moving average lines for the Hang Seng Index. By late 2008 and into early 2009 the Hang Seng Index bottomed as the WMT/SPX ratio reached a peak.
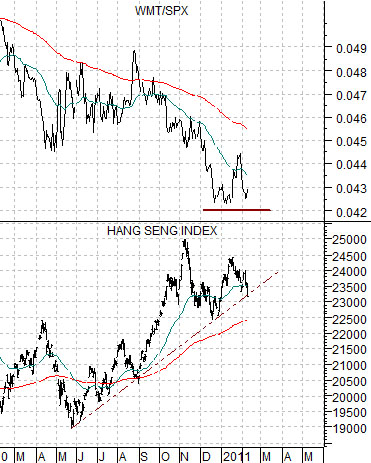
In any event… the point is that one of the ways to gauge the strength or weakness of the Hang Seng Index may be through the offsetting weakness or strength of the WMT/SPX ratio. With this in mind we shift to the chart at bottom right of the ratio and the Hang Seng Index from the current time period.
The first point is that the Hang Seng Index is still in a rising trend and remains well above its 200-day e.m.a. line. The second point would be that it wouldn’t take much more than another day or two of price weakness to bring the moving average line into play.
The third point is that a case can be made that the WMT/SPX ratio is making a bottom. However to have any near-term importance we suspect that the ratio will have to rise well above its 200-day e.m.a. line.
In summary the Hang Seng Index looks a bit shaky these days and we can see ‘small signs’ of a bottom for the WMT/SPX ratio. However unless the Hang Seng Index absolutely collapses it will be months or even quarters before the 100-day e.m.a. line will be set to ‘cross’ down through the 200-day e.m.a.