On the bad news side the situation in Greece is rapidly approaching the same level of crisis associated with Dubai just ahead of the $10 billion bail out from Abu Dhabi with Ireland perhaps not that far behind.
On the good news side Microsoft’s earnings beat expectations while Ben Bernanke was given Senate approval for a second term as Fed Chairman.
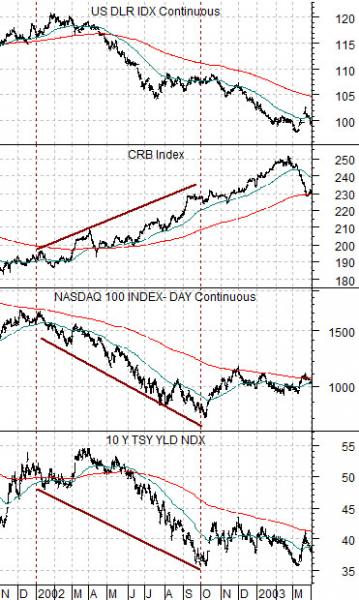
We are going to go ‘back in time’ today as we revisit a chart from 2002 . At right is a comparison, from top to bottom, of the U.S. Dollar Index (DXY) futures, the CRB Index, the Nasdaq 100 Index (NDX) futures, and 10-year U.S. Treasury yields (TNX).
We generally argue that ‘cyclical is cyclical’ which simply means that in general most cyclical markets trend in the same direction. However the key is that there are period of time when weakness in one sector or market will actually help create strength in another… which was most certainly the case back in 2002.
The declining trend for the Nasdaq during 2002 helped keep long-term Treasury yields from rising in the face of emerging price strength for commodity prices. In other words commodity price strength was given a 12 to 18 month head start without the negative offset of rising interest rates due to ongoing downward pressure from the tech and telecom sectors.
The argument is that the trend shift from ‘tech’ to ‘commodities’ occurred under the umbrella of a major sea change in the direction of capital flows. The foreign exchange markets serve as the gateways for capital so we can see that money began to move away from the U.S. in early 2002.
Our view is that 2010 has the potential to be 2002 ‘in reverse’. The dollar is starting to strengthen indicating that the flow of money towards the Europe and the various sectors associated with the BRIC theme is reversing. In a perfect world weaker commodity prices through 2010 will help hold yields from rising so that new cyclical themes can emerge. In a sense cyclical weakness could actually help incubate emerging cyclical strength in a manner similar to 2002.
Equity/Bond Markets
Some time towards the end of 2008 we had lunch with a good friend who has been in ‘the business’ for the past 30 years. He was heavily long oil shares- an unhappy proposition at the time- and noted that he obviously couldn’t have sold them that summer when oil prices reached a peak because they had dropped so far from their highs.
The point is that while on any given day the head lines might read that the stock prices of oil producers rose because crude oil prices were stronger… the equity markets ‘lead’. One might argue, in fact, that oil prices rose because the oil stocks were higher instead of the other way around.
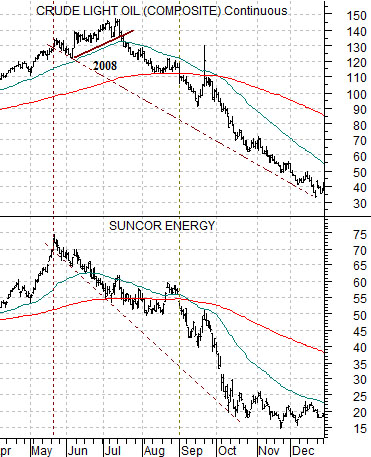
Below we show crude oil futures and the share price of Suncor (SU) from April of 2008 through December of that year. We have argued that for some strange reason SU’s share price tends to be about one half the price of crude oil. Notice, for example, that SU peaked in May of 2008 just below 75 while crude oil prices continued to rise into July before failing just below 150. By the 4th quarter SU was trading around 20 while crude oil found support close to 40.
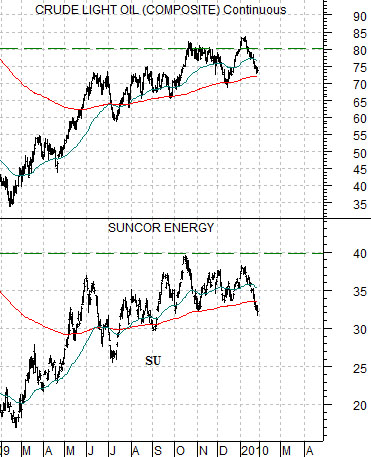
The chart below shows the current situation. SU peaked close to 40 back in October suggesting that crude oil prices should top out around 80. Not perfect, of course, but close enough.
Through trading yesterday the oil stocks were still leading crude oil prices to the down side. Our recurring page 5 argument is that we will need to see the oil shares start to rise relative to crude oil before the broad market is ready to swing back to the upside.
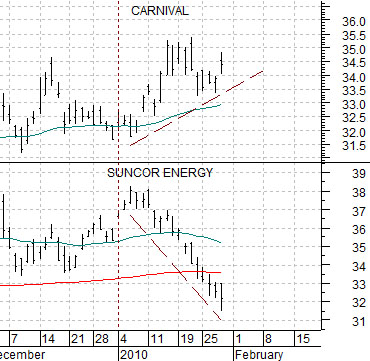
On the other hand… beneath all of the drama associated with a weaker trend for the S&P 500 Index this month we are starting to see the emergence of a few potential ‘offsets’. The banks were better yesterday, for example, along with some of the biotech (Amgen) and health care (JNJ) names. The chart below compares the share price of Suncor with that of Carnival Cruise Lines (CCL). Notice that the negative trend for SU this month associated with downward pressure for energy prices has actually gone with what appears to be a positive trend for CCL.