The issue, we suppose, is whether the markets can handle a decline in commodity prices and a rally in the U.S. dollar without imploding in a manner similar to 2008. In other words… has the trend run far enough and long enough with valuations in the non-commodity sectors declining to levels that will support a rising trend as an offset to weakness in the emerging markets, commodity currencies, and commodity prices.
We are going to focus on the broad relationships between Coca Cola, the laggard banks, gold and copper prices, long-term Treasury yields, and the U.S. dollar today. As one might expect this isn’t going to be ‘simple’.
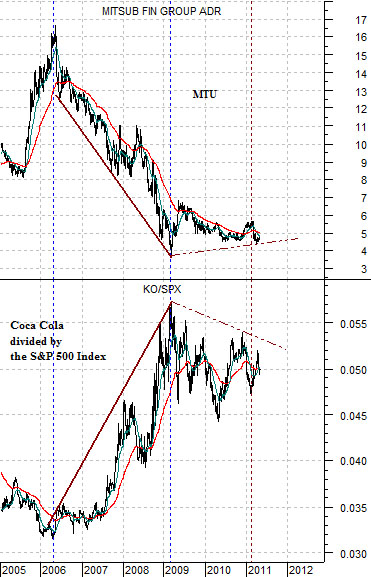
To start off with we have included a chart of Japanese bank Mitsubishi UFJ (MTU) and the ratio between Coca Cola (KO) and the S&P 500 Index (SPX) below. Note that we are looking at the relative strength for Coke instead of whether the stock price is actually rising or falling.
The argument here is that Coke outperforms the broad market when the trend for MTU is lower. The cyclical trend peaked some time between late 2005 and the spring of 2006 as the KO/SPX ratio reached a bottom.
Coca Cola outperformed the S&P 500 Index from 2006 into March of 2009 as the share price of MTU trended rather relentlessly lower. From there the trend shifted somewhat as the KO/SPX ratio tracked essentially sideways as MTU wallowed back and forth near its correction lows.
By way of explanation this has less to do with Coke and Mitsubishi UFJ and more to do with the themes that they represent. MTU is what we have termed a ‘laggard bank’ and it trends broadly with the kind of cyclical theme that goes with stronger copper prices and rising long-term yields. Coke, on the other hand, seems to trend better when the U.S. dollar is weakening on a year-over-year basis and also does relatively well when there is downward pressure on long-term interest rates.
Our initial ‘picture’ shows that for the last couple of years the markets have been somewhat mixed as MTU has trended sideways near its bottom while the KO/SPX ratio has trended essentially sideways near its top. This might go on forever but… our thought is that one of these days we are going to get a directional change in the dollar, bond market, or both which will either extend the KO/SPX ratio upwards or swing the share price of MTU back to the upside.
Equity/Bond Markets
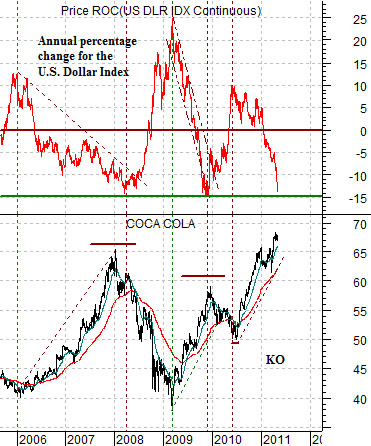
Next is a chart of the share price of Coca Cola and an annual percentage Rate of Change (ROC) indicator for the U.S. Dollar Index (DXY) futures.
The chart makes the rather compelling point that KO trends inversely to the direction of the ROC for the dollar. Keep in mind that we are not referring to whether the dollar is higher or lower on any given day but instead are referring to whether the dollar year-over-year percentage change is rising or falling.
To put this into some form of perspective let’s make up a few numbers. Say the DXY was ‘80’ a year ago and is ‘80’ today. The annual rate of change would then be ‘0’. If the dollar rose from 80 to 90 in May of 2010 and simply held flat in May of 2011 then the ROC would be declining because the dollar would be progressively lower on a year-over-year basis.
In any event… the chart makes the case that the ROC has tended to bottom recently when it approaches -15% so a case could be made that KO is approaching some kind of cycle peak. On the other hand… the dollar was very strong through May of 2010 with a peak reached in early June so the year-over-year change will likely remain under pressure through the next month.
Our points so far are that MTU and the KO/SPX ratio tend to trend in opposite directions. Coke, however, is often driven by year-over-year changes in the dollar and until we get into the final month of this quarter whatever upward pressure KO is getting from dollar weakness will likely continue.
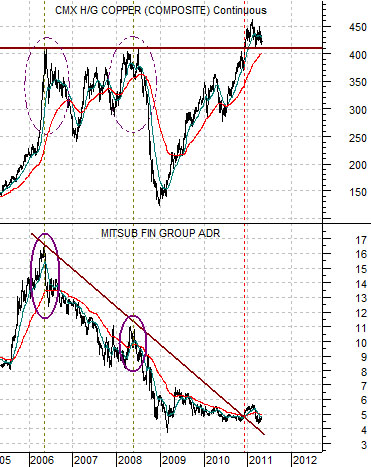
Below is a comparison between copper futures and the share price of MTU.
We thought we would put the trend for MTU into perspective using copper futures. We have often argued that ‘cyclical is cyclical’ which simply means that most cyclical themes tend to trend in the same direction. There are times when one theme is strong enough to put downward pressure on other themes- oil prices and the airline stocks are a good example of this- but over time a pause in the stronger theme will often lead to a catch up rally in those sectors under pressure.
We digress. The chart of MTU and copper futures makes the case that both represent the same basic trend. Copper topped out in 2006 at the highs for MTU (and lows for the KO/SPX ratio on page 1) and made a second rally into 2008 that created a lower peak for MTU.
The upside break out for copper late last year was strong enough to swing MTU’s trend from bearish back to flat. In other words copper breaking its ‘flat’ resistance line was as significant as MTU breaking up through its downward sloping resistance line. Copper went from ‘flat’ to ‘up’ while MTU shifted from ‘down’ to ‘flat’.
From this perspective one of the ways that the laggard banks might actually rise in price would be through an extension of the rally for copper futures prices.