One of the scuzziest things that writers can do- in our view- is selectively self-quote. We write too many stupid things far too often to ever be afforded the luxury of saying… we told you so. We do our best not to remind our readers of the calls that we got right in the hopes that our readers won’t take the time to remind us too often of the calls we got wrong. However… we are going to make an exception today.
From the IMRA one week ago (June 17, 2011): ..we think that oil prices will continue to decline. The problem isn’t declining oil prices as much as the reason ‘why’ oil prices are falling. If oil prices move lower on slower demand… then yields and cyclical asset prices will fall. If, on the other hand, oil prices decline on an increase in supply… then the outcome can be bullish. Our view is that in some way, shape, or form the U.S. will add supply to the markets through the Strategic Petroleum Reserve within the next few weeks. Whether this is a flat-out dump or some kind of sweet crude for Saudi sour crude swap has yet to be determined.
Nailed it.
The argument is that the markets have been setting up for this event since the end of April. The next question is… how far and how fast will oil prices decline?
Our sense is that Brent crude futures and gasoline futures may very well be in the early stages of a ‘crash’. Our sense is that the timing of the inventory dump was brilliant because it has effectively magnified the reaction by pinning it against the end of the quarter. Our sense is that this is the single most powerful policy lever that could be used to stimulate developed markets consumer spending just as QE2 comes to an end.
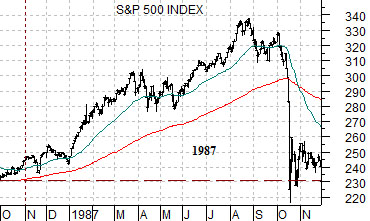
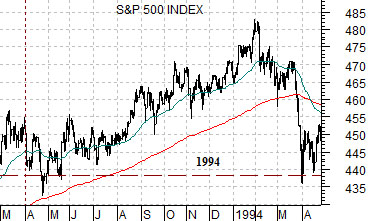
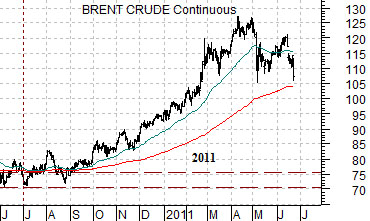
Below are charts of the S&P 500 Index in 1987 and 1994 along with Brent crude futures from the current time frame.
If this is a ‘crash’ then the two SPX charts should provide us with a general picture of what could happen next. In essence a well-orchestrated attack on a one-sided oil futures market could knock the last 12 months worth of price gains off of the map in a matter of days. This puts the near-term target for Brent crude down between 70 and 75 and argues for a potential bottom for gasoline futures at or below 2.00.
Equity/Bond Markets
June 23 (Bloomberg) — Oil tumbled to the lowest price in four months after the International Energy Agency said its members would release crude from strategic reserves.
Oil fell as much as 6 percent as the agency announced the release of 2 million barrels a day for 30 days beginning next week to help make up for a Libyan supply disruption.
In sequence we were looking for a sharp decline in oil prices late in the quarter with bond prices peaking close to quarter-end. This would then be followed by a third quarter break for gold prices which would initiate the recovery of the laggard sectors in general and the banking sector in particular.
Whether the oil price tumble is going to large or small may well depend on the equity market’s reaction.
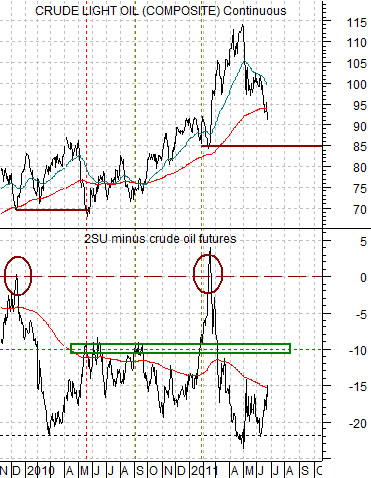
The chart below compares crude oil futures with the spread between 2-times the price of Suncor (SU) and crude oil.
The argument is that when the spread between SU’s share price and crude oil starts to dramatically decline the equity markets are ‘saying’ that the rise in oil prices is both bearish and temporary.
Between December of 2009 and February/March of 2010 the spread fell from around ‘0’ down to ‘-20’ as crude oil prices rose from 70 up through 85. Oil prices subsequently declined back to 70 as the spread moved up to ‘-10’. This particular sequence as served as our road map or template.
The idea has been that ever since crude oil prices moved up from 85 the spread between Suncor’s share price and crude oil has weakened. If history were to repeat the next bottom for crude oil might be found at 85 but only if the oil stocks react in a neutral to positive fashion.
Let’s put it this way: at time of writing Suncor was trading in the 38’s. Two times 38 equals 76. In order for the spread to move up to -10 the price of WTI would have to fall to around 85- 86. If, in the process of moving down to 85, the price of SU declined to 30 then the next buy signal would requires oil prices closer to 70. And so on.
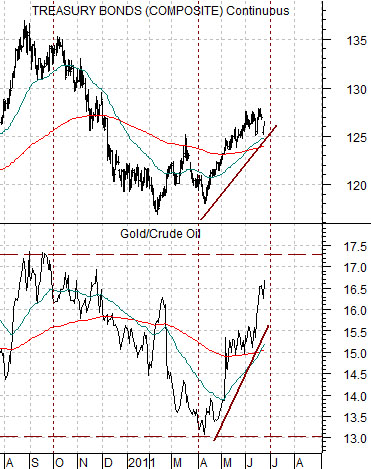
Below is a chart comparison between the U.S. 30-year T-Bond futures and the ratio between gold and crude oil.
A quick note- the front month contract for the TBonds changed earlier this week from the June contract to the September contract. The ‘roll’ results in a lower bond price and the typical reaction over the next day or so is for bond prices to rocket higher to hold the original trend. Much of what we saw in trading yesterday was the ‘recapture’ of the price difference between the June and September contracts. When this happens you tend to get a somewhat out-sized reaction in the markets because it looks as if bond price strength is based on economic weakness.
In any event… gold outperforms copper and crude oil when bond prices are trending higher. Our expectation has been that bonds will trend higher into the end of the quarter and then pivot back to the down side and that this will show up as rather intense gold price weakness through the second half of the year.