It should not be too much of a stretch to argue that a bull market is based on a steady inflow of capital. There are times when a market will rise simply by association which, we suppose, is similar to the adage that when the wind blows strongly enough even turkeys can fly but, more or less, it takes an ever increasing flow of money to push prices higher on a sustained basis.
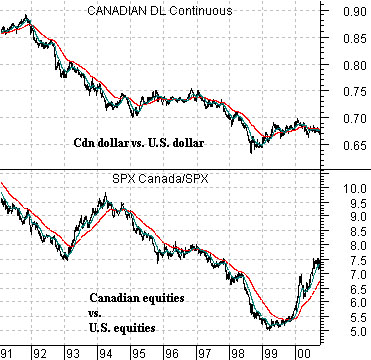
Belowwe show a chart of the Canadian dollar (CAD) futures and the ratio between the Canadian stock market (S&P/TSX Composite Index) and the U.S. stock market (S&P 500 Index) between 1991 and 2000.
The argument is that while Canadian stocks enjoyed reasonable price gains at times through this decade the flow of capital- as measured by the trend of the Canadian dollar- was most clearly not in favor of Canadian assets. The TSX Comp. could rise by association but it was not ‘the bull market’. The forex market serves as the door way for capital flows so as long as the Canadian currency was declining relative to the U.S. dollar the flow of capital- and hence the trend- favored the U.S. market.
Of course from 1999 into 2008 the trend reversed with the Canadian dollar rising to reflect the commodity trend but that is not our point today.
If capital moving towards a market or region defines the trend then when is the inflow of capital actually a negative?
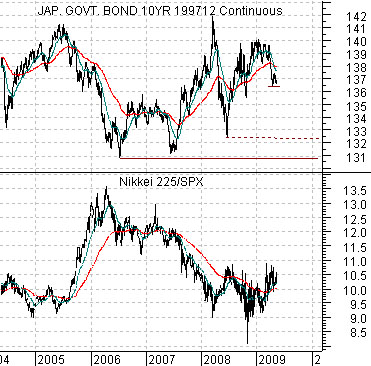
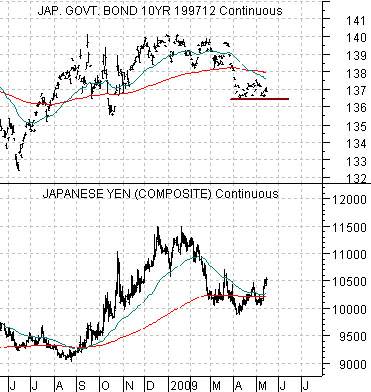
Belowwe show the Japanese 10-year (JGB) bond futures and the Japanese yen (JPY) futures.
Many believe that a stronger yen will do great damage to Japan’s export-driven economy. Our thought is that this may well be true but only if- and this is the key- this goes with rising Japanese bond prices as was the case through the second half of last year. We will argue that the most bullish combination of intermarket factors that we can think of with regard to the Japanese asset price theme would be yen strength and Japanese bond price weakness because… this would show not only that money is moving towards Japan (stronger currency) but also that Japan’s economy was starting to expand (rising interest rates).
Equity/Bond Markets
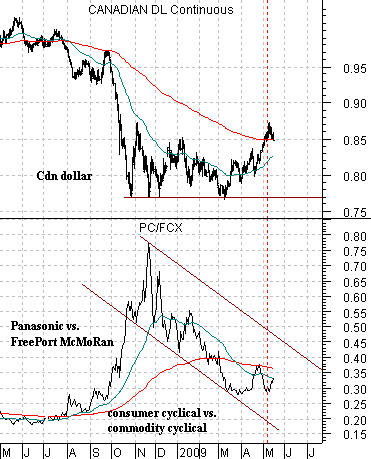
Belowwe compare the Canadian dollar (CAD) futures and the ratio between Panasonic (PC) and FreePort McMoRan (FCX).
The basic point is that a stronger Canadian dollar goes with rising commodity prices and Japan is a commodity ‘user’ while Canada is a commodity ‘producer’.
The second point would be that both PC and FCX are cyclical (i.e. economically sensitive) but FCX tends to do better when the Cdn dollar is stronger.
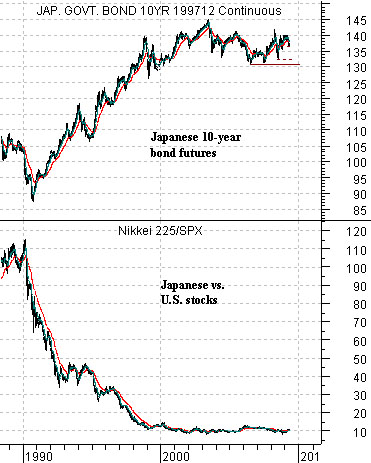
Let’s leave this point for a moment and move on the chart below. This chart compares the Japanese 10-year (JGB) bond futures and the ratio between the Nikkei 225 Index and the S&P 500 Index from roughly 1988 to the present day.
What jumps out from this chart is that the Nikkei was once more than 110 times the SPX and is now closer to 10 times and… this relative strength bear market has gone with rising Japanese bond prices. On the other hand the Japanese bond market has actually been close to flat for the past decade while the Nikkei/SPX ratio has flattened out near the 10:1 line. We show a shorter-term view of the relationship below.
Towards the start of the current decade we were arguing in favor of commodity prices and quite strongly in favor of the Canadian and Australian dollars. Most felt, however, that a stronger Cdn dollar would cripple Canada’s economy simply because they could not imagine a set of circumstances that would justify the Cdn dollar pushing all the way to above parity with the U.S. currency. Our thought is that Japan may represent a similar opportunity but for yen strength to be a positive we have to get confirmation from the bond market. In other words if the yen rises and Japanese bond prices rise in tandem then yen strength is a negative. If, on the other hand, the yen continues to resolve higher and at some stage the JGB futures break down below roughly 136.50 with 10-year Japanese yields moving above 1.50%… then we think we could be the early stages of a most intriguing and largely unexpected Japanese asset price bull market. Time will tell.