Nov. 28 (Bloomberg) — Treasuries posted their biggest monthly gain since Ronald Reagan was in the White House, as President-elect Barack Obama said the U.S. faces a “time of great trial” and the economy shrinks.
Nov. 28 (Bloomberg) — U.S. stocks gained, capping the biggest weekly advance for the Standard & Poor’s 500 Index in 34 years, on speculation that government bailouts will shore up the economy.
We suppose that if there is a good time to be away from the markets for a couple of weeks… this might be it. As noted above U.S. Treasuries just finished their best month since 1981 while the S&P 500 Index just completed the best week since 1974. At the very least the markets have created a little bit of breathing room as we move into the month of December.
We thought that we would start off today with yet another macro perspective. This was an argument that we used through much of the first half of the year so we thought it might be appropriate to revisit it now.
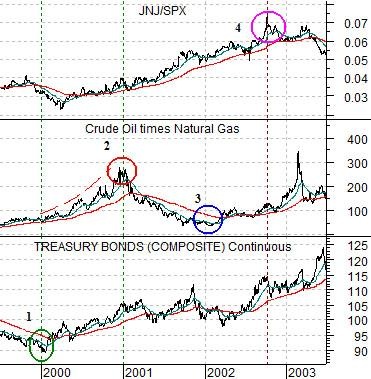
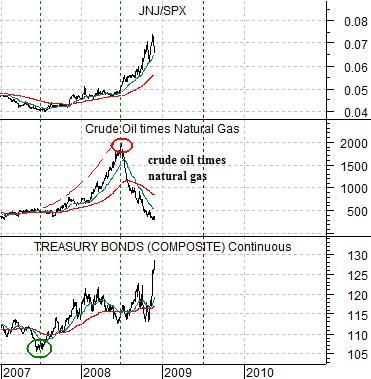
The charts at right compare the U.S. 30-year T-Bond futures, the combination of crude oil futures times natural gas futures (energy prices), and- just to do something a bit different- the ratio between the share price of Johnson and Johnson (JNJ) and the S&P 500 Index (SPX). The top chart starts in mid-1999 and runs into mid-2003 while the lower chart begins at the start of 2007.
The idea was that the long end of the Treasury market turned higher in price almost exactly one year before energy prices reached a peak in 2000- 2001. If history were to repeat then the mid-2007 pivot upwards for TBond futures prices (confirmed by the start of strength in the JNJ/SPX ratio) would argue for a mid-2008 top for energy prices. The rest, we suppose, is history as this was almost the exact peak for energy prices this year.
The second part of the argument was that it would take energy prices roughly one more year to reach the next bottom and we could see a lower interest rate trend for another year after that. In other words it should be mid-2009 before energy prices next start to rise in earnest and some time into 2010 before the JNJ/SPX ratio reaches a final top.
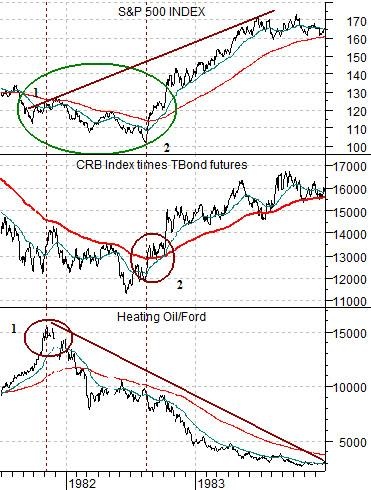
In recent issues we have been focusing on two relationships. The first had to do with the way the equity markets (SPX) trend with the combination of commodity prices (CRB Index) and long-term Treasury (TBond futures) prices. The second related to the way the equity markets tend to pivot upwards once the ratio between energy prices (heating oil futures) and the autos (Ford- F) reaches a final cycle peak.
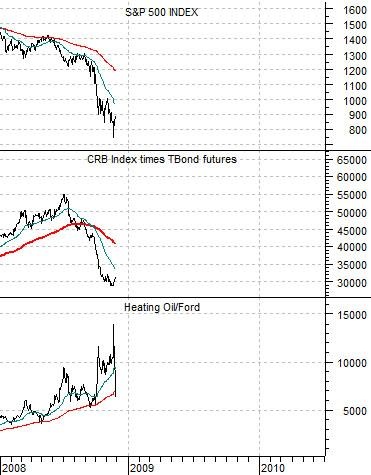
The chart at right shows the SPX, the CRB Index times TBond futures, and the heating oil/F ratio from mid-1981 through 1983. The chart below right shows the same relationships from the start of 2008.
The point is… one of the features of the recession-driven equity bear market that bottomed in August of 1982 was an upward pivot or starting point in late 1981 and an actual pivot that pushed prices back to the rising trend in August of 1982. In other words the SPX turned higher in late 1981 when the heating oil/Ford ratio peaked and turned lower even though the damage from the recession managed to push the equity markets lower for another 9 or so months.
We mention this because it appears that the heating oil/Ford ratio has made an important cycle peak so we are going to argue that the trend for the SPX is now higher. The only problem that we can see at present is that we still are not looking for any strength from the commodity sector until the second half of 2009 which means… that the CRB Index times T-Bond futures could hold near the lows for another few quarters which has the potential to ‘sag’ the equity markets lower through the first half of next year.
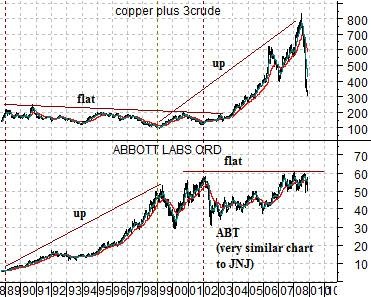
Below we have included a comparison between Abbot Labs (ABT) and the combination of copper futures prices and crude oil futures (copper in cents added to three times crude oil in dollars).
The argument is that the consumer/health care/financial themes tend to do better when commodity prices are flat to lower. We do not mean that copper and crude oil prices have to decline from current levels but instead are suggesting that the highs set this year should hold for some time. If so… then this should be confirmed by a rising trend for ABT that takes it to new highs. This is, in fact, one of the intermarket keys that has so far been missing. Weakness in commodity prices should lead to strength in financial asset prices and a rising equity/commodity ratio.
