Back to two screens for trading today after scrubbing the hard drive and reinstalling Widows – which made the old PC way faster. Also discovered you can prioritize operating processes when you have multiple programs running, which helped make my charting software quicker as well. To do this, FYI, you just go to Task Manager -> Processes -> Select Program -> Right Click -> Set Priority -> Real Time. Smooth sailing until Comcast went down for ten minutes again this morning!
I am finally to the point where I can articulate a trading strategy. It is not original by any means as its based almost entirely on the Green on the Screen model. Torexal’s post at Stack your Cream helped clarify all this over the weekend and I sent Adam an email with a couple questions and he generously responded back by email. Here are my general “rules” for trading right now:
1) Create a short watch list of five stocks every night. Right now I compile many watchlists from all the various blogs, but I’m just not that good yet to monitor 100 plus stocks each day. I’m still going to scan the compiled master list, but will force myself to really understand 5 of the most promising charts. This is something I haven’t done up until now.
2) Run the Co-Relation, Gap Stat, and Support & Resistance calculators on the brief list. These tools will give me an idea how my watchlist stocks trend with the DOW, how often they gap up or down the next day after a price movement, and their average day range of support and resistance.
3) Follow the overall market trend. For the most part, when the market is green, I will look to go long, and when the overall indexes are red, going short will be prioritized.
4) Resistance and support breaks. Standard technical analysis tactic, will look how the stock is reacting to support and resistance levels from past week.
5) 10/60 SMA Crosses on 5-Minute Chart. Looking for crossovers to the down and up sides. As moving averages are lagging in general, will look at multiple time frames and other indicators to not get too behind.
4) Volume Change. Spikes in volume sometimes signal a breakout in price up, while a contraction in volume can hint the price is about to drop.
5) $1 and $.50 Price Thresholds. With these gutter stocks, the crowd seems to respond to these round number price benchmarks and when a stock reaches or falls under one of these thresholds, it can indicate where its heading.
6) Level II Direction. I haven’t figured this out yet after looking at Bid and Ask data in Level II, but in general, I want to see steady Bids and Asks in the direction I think the stock is going.
7) Look for news. See if there is news that is driving the price movement.
8) Monitor RSI, MACD, and Stochastic indicators. I’m just learning these so at this stage I just checking them out on the charts and not making any decisions on them.
So, I started to follow these guidelines today, but it didn’t result in any success right away. Part of this was TOS Paper Money would not allow me to borrow shares of any of the many stocks that were great shorting opportunities today: GGP, HTZ, LIZ, MPG, EMKR, F, SAH, etc. I plan on either going with Interactive Brokers or several accounts across numerous brokers, so in my paper trading, I may decide to go back to my coin flip to simulate borrowing shorting shares if TOS Paper Money makes it impossible to ever short gutter stocks.
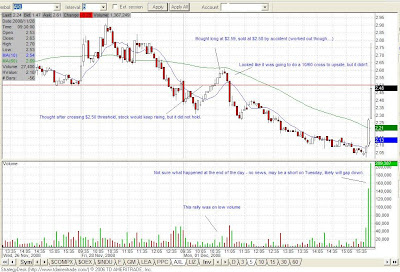
However, I did make two paper trades: AXL and CROX. I’m posting a chart below, mostly for my own education and to make myself be more rigorous in my analysis. AXL looked like it was going to breakout a bit, and crossed the $2.50 mark, but it failed to continue this momentum. I put in what I thought was a stop loss order, but didn’t click that box, so a limit sell order instead went in instead, so 5 minutes after entering this trade, I exited AXL – which was good because it started to tank right after that. It turned out to be a better stock to short than go long. This in part was because it was moving up on low volume. Another factor was that when the Dow is red, according to the co-relation calculator, AXL goes red 65.79% of the time. I also went in long on CROX at $1.37, but it flatlined the rest of the day. I ended up down $50 for the day, 80% of that from commissions.
As you can see, AXL would of been great to short from $2.60 down to about $2.05. I’m not sure what happened at the end of the day, but I wouldn’t be surprised if gapped down from here. But the volume was unreal with this spike so I’m not sure what to make of it yet. I will be working on Tuesday, but hope to get back to paper trading on Wednesday.


