Today’s chart presentation was inspired by a Goldman Sachs research report published last week. The gist of the report’s argument was that recent natural gas inventory levels could not be explained wholly by changes in U.S. industrial production. Similar to 2001 the low price of natural gas appeared to be creating an incentive for power producers to switch from burning coal to natural gas.
As long as natural gas prices remained below around 4.40- the cash cost equivalent of coal- the demand for natural gas as a substitute for coal would rise. Eventually decreased supply from drilling coupled with an increase in demand would help to bring the gas market back into balance. Fair enough.
The problem is that the bullish argument for natural gas prices over the longer-term revolves around a bearish argument for gas prices in the here and now. In other words if natural gas prices were pushed back above 4.40- a short-term bullish response- the bullish long-term argument disappears because the incentive to switch from coal to gas disappears.
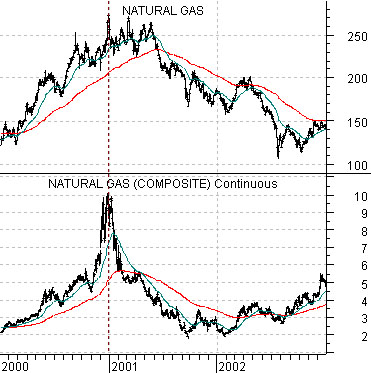
Belowwe show natural gas futures and the Natural Gas Index (XNG) from 2000 through 2002.
Between October of 2001 and March of 2002 U.S. coal demand for the production of power declined by close to 28 million tons while natural gas demand increased by 1.7 Bcf/d. Concurrent with this coal production declined which helped hold coal prices high enough to facilitate the switch over to gas. By early 2002 natural gas prices steadied out while the share prices of natural gas producing equities continued to decline into the autumn of that year.
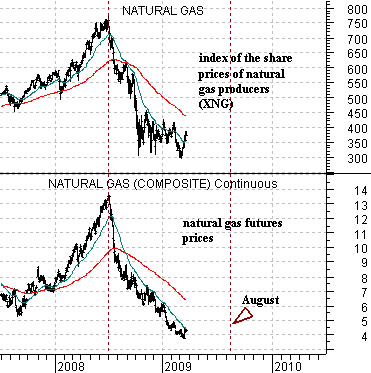
Our points are as follows. First, natural gas inventories are still too high and it appears that the best way to move supply and demand back in balance is through lower prices. Second, with the heating season now behind us the next positive time frame for energy begins in August. Third, it usually takes close to two years for a truly extended market to come back into balance. Fourth, the Natural Gas Index is finding support around 300 which is higher than the cycle peak made back in 2001. Fifth, the markets seem to be trading as if energy prices were going to spike to new highs at any moment but our sense is that it could be at least August and perhaps well into 2010 before the price trend swings back to positive once again.
Equity/Bond Markets
So… why are we interested in natural gas futures prices? As one might expect not for obvious reasons.
A number of sectors showed very strong price growth through the 2000- 2002 equity bear market before running out of gas, so to speak, during the spring of 2004. From an intermarket perspective this is best explained by the trend for energy prices. In other words energy prices were somewhat dormant from late 2000 into early 2004 and then were very strong from 2004 into 2008. The flat trend for energy prices allowed money to flow into an assortment of non-energy themes while the return to price strength helped draw money back to the commodity producing sectors.
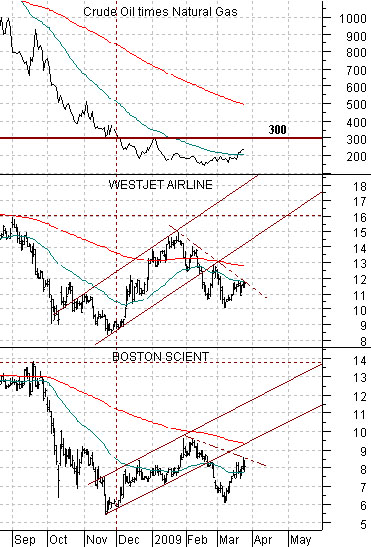
The chartbelow compares the share prices of Boston Scientific (BSX), Canada’s WestJet (WJA- one of only three airlines, we understand, to make money last year), and the product of crude oil times natural gas futures.
From 2000 into late 2003 the product of crude oil times natural gas remained below around ‘300’. Through this time frame both BSX and WJA were strong both on an absolute basis and relative to their respective market indices. The BSX/SPX ratio rose close to 8-fold from the end of 2000 into the spring of 2004 while the WJA/S&P/TSX Composite Index rose around 5 times from early 2000 into the end of 2003.
The point? We would like to see the product of crude oil times natural gas remain nicely below ‘300’ for a few more years so that money can find something else to do besides chase energy futures and energy-related equities.
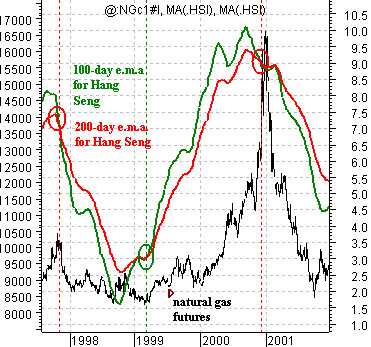
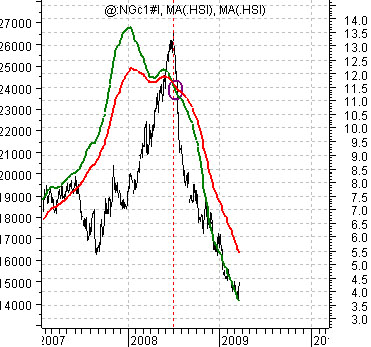
Below we show two charts of natural gas futures overlaid with two moving averages from Hong Kong’s Hang Seng Index. One of our stranger views is that the Hang Seng leads natural gas prices so we use the ‘cross’ by the moving averages as an indicator of the trend for gas prices. When the moving averages cross to the upside- as they did in early 1999 we view the trend for natural gas as positive. When the m.a. lines cross to the down side- as they did in late 1997, the end of 2000, and again in the summer of 2008- the trend is negative. At present, of course, the trend remains negative.