On occasion the short-term trend for the markets becomes so confusing and so fraught with emotion that we find that it makes sense to take several large steps back in search of perspective. This is especially true during periods of perceived crisis.
Every now and then we return to the argument regarding ‘traction’. In 2000 peak earnings per share for the S&P 500 Index reached 57 as the SPX pushed above 1500. In 2007 peak EPS rose to 91 (data courtesy of Goldman Sachs ECS Research) as the SPX rose once again above 1500.
The point is that U.S. large cap stock prices got so far ahead of earnings into 2000 that a period of consolidation was called for. Through the ensuing decade as the SPX chopped back and forth below the 1500 level money was literally set free to pursue higher returns in other markets.
Below is a chart comparison between the share price of IBM and the ratio between the S&P 500 Index and CRB Index (equities/commodities) from the mid-1990’s to the present day.
Our premise is that as long as key stocks such as IBM continue to trade below the highs set at the end of the 1990’s any weakness in commodity prices or strength in the U.S. dollar is going to be perceived as a negative. Why? Because for the past ten years as U.S. large caps have languished growth has generally been focused in those sectors related to the production of basic materials. Whether the story is Asian demand for commodities or the strength of the commodity producing countries the underlying point is that all of this has been occurring under the umbrella of a valuation contraction with regard to the U.S. large caps.
A time will come when the SPX rallies up to 1500 and then keeps on going. Our thought is that IBM’s proximity to the 1999 highs puts in position to be an early relative strength leader. A push through 140 for IBM would suggest that the valuation contraction for U.S. large caps has come to an end and as traction returns to this sector the dependence by the markets on commodity price strength will start to fade.
The chart suggests that new highs for IBM will alter the trend within the markets away from a commodity-focused theme as the SPX returns to a rising trend relative to commodity prices.

Equity/Bond Markets
Above we argued that the recent fixation on even small changes in commodity prices relates to the fact that U.S. large cap stocks have been suffering though a decade-long consolidation following the series of sector peaks that were made between roughly 1998 and 2000. Fair enough.
One of the problems associated with the markets is that trends tend to run for years before they become apparent. The first page chart, for example, shows that commodity prices began to rise relative to the S&P 500 Index back in 1999 although our sense was that this trend was not broadly embraced until at least 2004 and likely closer to 2006.
In any event… the markets trend over the past decade has been focused on raw materials price strength. The markets trend for the next decade should be tilted more towards creating growth in spite of higher commodity prices or, perhaps, in finding new ways to limit the usage of those resources that are perceived to have limited supply.
The point that we are madly circling has to do with energy prices and the autos.
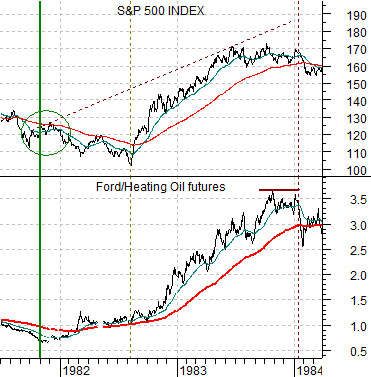
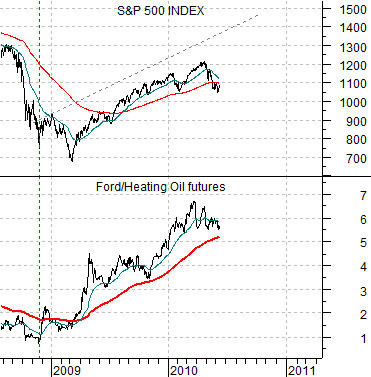
The chart below compares the S&P 500 Index with the ratio between the share price of Ford (F) and heating oil futures from 1981 into 1984. Below right we show the same comparison from mid-2008 to the present day.
Following the commodity bull market that peaked into 1980 the U.S. economy suffered through two recessions that came to an end some time around the second half of 1982.
The chart shows that months ahead of the low point for the SPX in August of 1982 the ratio between Ford and heating oil reached a bottom and began to rise. The SPX went through a series of small rallies in late 1981 only to slump to new lows through the summer of 1982. The rally during 1983 swung the SPX back to the rising trend line established back in 1981.
Notice that through 1982 and 1983 the ratio between Ford and heating oil futures (energy users versus energy prices) managed to hold above the rising 200-day e.m.a. line. The first serious test of the trend was made in early 2004.
Our thought is the current cycle is somewhat similar to the early 1980’s. The ratio between Ford and heating oil futures prices bottomed in late 2008 some months ahead of the broad markets and has been pushing higher ever since. After creating a rising trend line through the final months of 2008 the SPX has worked fairly hard at coming back ‘on trend’.
The point? The Ford/heating oil ratio has corrected lower on a number of occasions over the past 18 months but even through the Eurozone crisis and the knee-buckling sell off of consumer cyclical sectors it remains nicely above the rising moving average line. In a sense the charts are suggesting that surprises still lie to the upside. Unless the Ford/heating oil ratio breaks back below 5:1 due to sharply rising energy prices or even greater downside pressure on the share price of Ford… our sense is that it still makes sense to view the markets from the perspective that the glass remains half full.