To put this into perspective the markets can ‘split’ or diverge for extended periods of time. The tech sector, for example, dominated the equity markets to the detriment of rate-sensitive groups like the banks for 7 quarters from mid-1998 through into the early 2000. The energy sector has risen while the pharma sector has been under pressure for more than a decade so an argument based on a one-quarter divergence is somewhat… tenuous.
We stated last year that the markets had entered into a one-quarter ‘crisis’ trend through the second quarter in a manner similar to the pre-Gulf War equity bear market of 1990. By mid-year the sense of Eurozone panic began to lift as yields and equities swung back to the upside.
We do not know and can not know at this time whether the Middle Eastern and North African problems will fade away by next month but we do know that the rising trend for energy prices has been creating havoc within the markets.
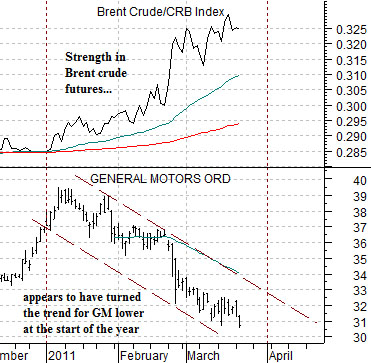
Below is a chart comparison between General Motors (GM) and the ratio between Brent crude futures and the CRB Index.
The chart makes the rather obvious point that as Brent crude began to lift relative to broad commodity prices in January the trend for GM turned lower. With GM giving back close to 25% of its market cap and trading below what was expected to be a fairly attractive IPO price we get a sense of how strong energy prices have been punishing the energy ‘users’ through the first quarter of this year.
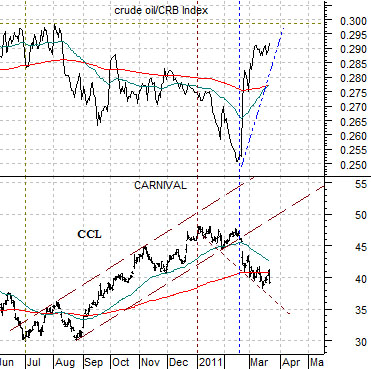
Another view is shown below right as we compare the share price of Carnival Cruise Lines (CCL) with the ratio between crude oil futures and the CRB Index.
While CCL began to decline in January its trend did not break the rising trading channel until the crude oil/CRB Index ratio spiked to the upside in mid-February. There are all kinds of charts out there that show a faltering trend starting in the middle of February and our view is that this has everything to do with the sharp rally for crude oil prices.
The point is that energy prices are still pushing higher with rising oil stock prices helping to mask the damage done within the markets. If this is a one-quarter issue then it should lead to calmer energy prices next month confirmed by a price move back above 33 for GM.
Equity/Bond Markets
March 22 (Bloomberg) — Crude rose on speculation Japanese rebuilding efforts will bolster fuel consumption and as unrest spread in the Middle East and North Africa.
The big problem with looking at the ‘split’ within the markets due to stronger energy prices as a one-quarter issue may be explained using the two charts at right. We hope.
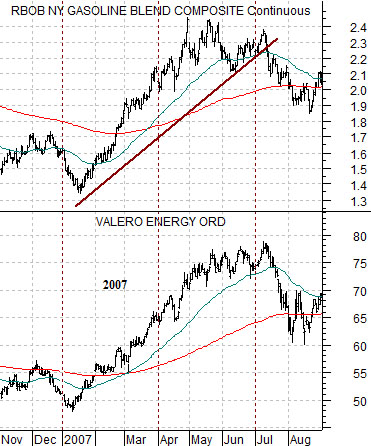
The next chart contrasts gasoline futures with the share price of oil refiner Valero (VLO) from late 2006 into 2007.
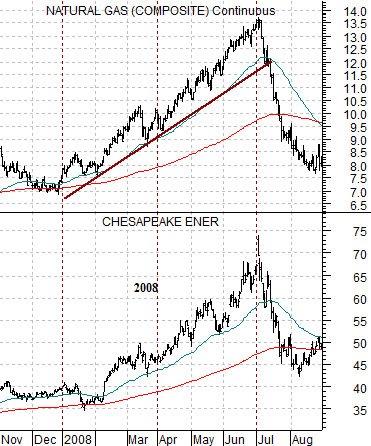
The bottom chart compares natural gas futures prices with natural gas producer Chesapeake (CHK) from late 2007 into 2008.
One of our recurring arguments through the last few years of the previous decade was that we kept getting strong energy price trends over the first half of the year followed by trends that favored other sectors over the final six months. In other words- as the charts at right attest- it was quite normal for energy prices to bottom in January and then push higher through the end of June. Investors that went long energy stocks early in the year and held them through the second quarter did very nicely while those who failed to exit at that juncture ended up giving back most or all of the gains.
The point is that if the overall trend has not changed then the simplest conclusion to make would be that we are closing in on the half-way point of a trend that favors rising energy prices. If history were to repeat then the trend- led and dominated this time around by Brent crude- would simply power through into the end of June.
Obviously we are rarely enamored with simple conclusions when we can make the issue more complex.
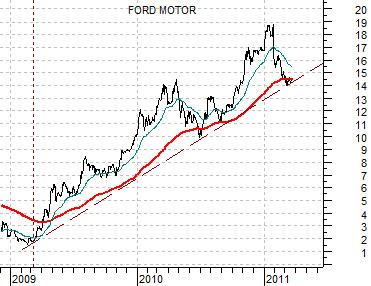
The last chart shows the share price of Ford as it has trended upwards from the March 2009 lows. Notice that it declined to the support line at the end of the second quarter of 2010. This marked the conclusion of the one-quarter Eurozone crisis. Now it has declined back to the trend line in step with the state of rolling Middle Eastern crisis combined with Japan’s earthquake and tsunami. In both instances Ford’s share price declined to just below its 200-day e.m.a. line. The point? If Ford manages to hold the trend line (i.e. remaining above 14 on a closing basis) then we can make a case for a shift back away from ‘strong energy prices’ as early as next month.