May 6 (Bloomberg) – U.S. stocks advanced to a four-month high as investors speculated banks don’t need as much capital as had been projected and a report showed employers cut fewer jobs than economists estimated.
Earlier this week we laid out four potential outcomes for the equity market. Today we will add a fifth on, appropriately enough, today’s fifth page.
For months (and months) we have focused on the fact that the last time the major oil stocks reached a cycle-ending relative strength peak against the broad U.S. large cap market (Amex Oil Index divided by the S&P 500 Index) was in the autumn of 1990. This coincided with what Bank of America/Merrill Lynch economist David Rosenberg described as, “The only time in the past six decades we actually saw a sustained post-recession bull market with growth this weak was in the 1990- 91 turnaround. Then again, at that time, we were coming off of the shallowest recession in the post-war period.“.
We often argue that it makes more sense to forecast the economy off of the stock market than vice versa. If the stock market continues to rally then it means that the economic recovery is distinctly ‘V’ shaped. If the stock market fails this month then the recovery will be more like a ‘U’ or, we suppose, a bit like an ‘L’.
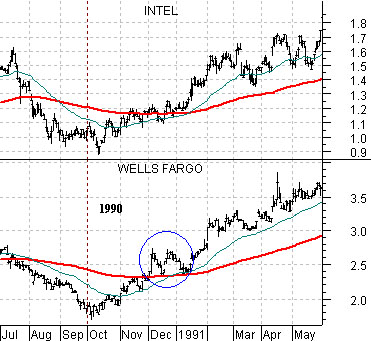
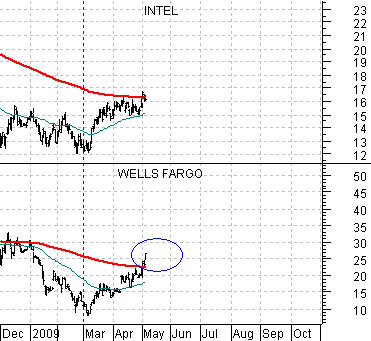
Our point is that through trading yesterday one would be hard pressed to tell the difference between the recovery in the share prices of Intel (INTC) and Wells Fargo (WFC) following the relative strength peak for the major oils in October of 1990 and the recent peak in March. At right we show INTC and WFC from July of 1990 through May of 1991 and INTC and WFC from December of 2008 forward.
The one detail that we found intriguing was the way WFC spiked up through its 200-day e.m.a. line roughly two months into the recovery. The same thing happened in early December of 1990 as WFC exploded up through its moving average line while Intel continued to chop around its moving average line until mid-January of 1991.
The argument would be that to date the equity markets are trading as if the bear market is over and the recovery has already begun. Our view, of course, was that the equity markets would rally higher into May and then make some sort of major decision as to the pace and proximity of the global recovery.
Equity/Bond Markets
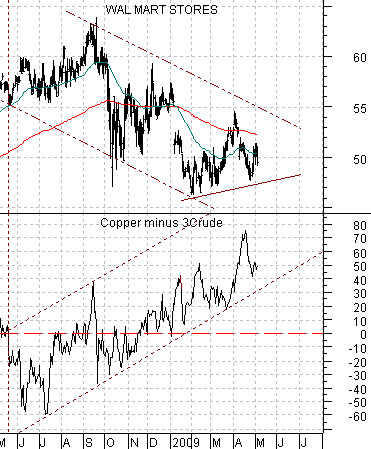
Below we show a chart of Wal Mart (WMT) and the spread between copper prices (in cents) minus crude oil prices (in dollars and multiplied by 3 times). The argument is that over time copper tends to trade at a price that is close to 3 times crude oil. When copper is stronger than crude oil the spread rises- as it has been doing since the summer of 2008- and this tends to go with Asian growth.
Our ongoing thought is that if China’s recovery is going to flounder later this year then the first crack will come from copper futures prices both on an absolute basis and relative to crude oil. To the extent that WMT tends to trade inversely to Asian growth as long as WMT is trending lower the markets are still trending in a ‘China positive’ manner.
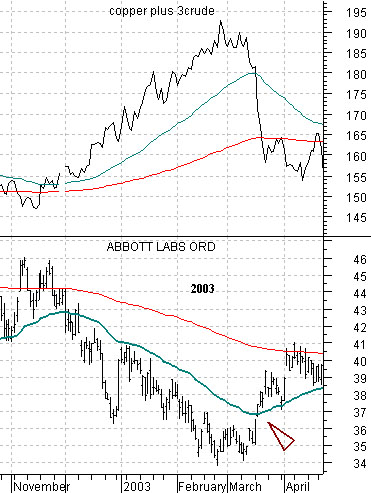
One of the potential outcomes that we showed for the equity markets revolved around the way the stock market behaved through the end of 2002 and into 2003. After making a major bottom in the autumn of 2002 the S&P 500 Index rallied upwards for 2 months and then declined for 3 months into March of 2003.
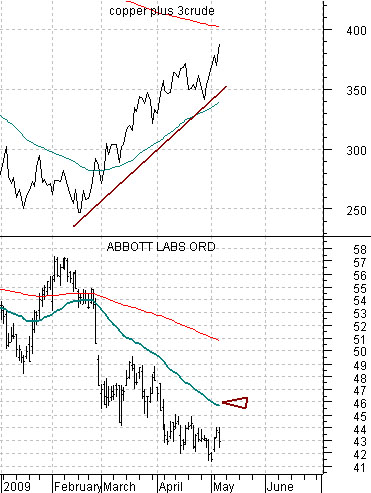
The problem with using this as a comparison for the current time frame is that, by and large, the markets have already waded through a similar kind of correction. The three month stock market decline went with rising copper and crude oil futures (chart below) and a steady downward trend for Abbott Labs (ABT). The chart below right shows that ABT has been pressured lower since late February in response to stronger metals and energy prices. Our recent point has been that if, as, or when ABT punches up through its 50-day e.m.a. line the rising trend for energy and metals prices will have come to an end.