The stock market crashed in the autumn of 1987 prompting a wave of forecasts of impending economic doom. What was interesting was that the commodity cyclical sectors led the stock markets higher into the crash and essentially led the stock markets through the subsequent recovery.
Our point is that contrary to the views of most economists the U.S. economy did not slip into a depression- must less a recession- in the wake of the crash. Our view is that recessions create major trend changes within the financial markets so our expectation is that the trend for the markets coming out of the current debacle should be different than the trend going into it.
The problem is that the markets still seem intent on returning to the previous commodity-based theme. The commodity currencies are soaring, the U.S. dollar is tanking, energy and base metals prices are rising, and all eyes are focused on China. Aside from lower asset prices the recession-based ‘cleanse’ has yet to alter the markets’ interpretation of the source of future growth.
As we run through the markets from a myriad of perspectives we keep returning to the idea that this is still all about the price of crude oil and copper. We try to keep in mind that during the May/June time frame the world always seems destined for ever-expanding growth while reminding ourselves that the equity markets have fixated on energy-related themes through the first half of recent years before switching over to non-energy themes during the final two quarters.
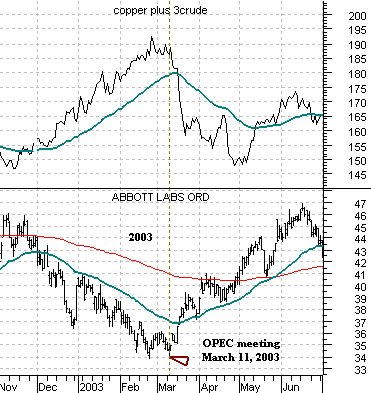
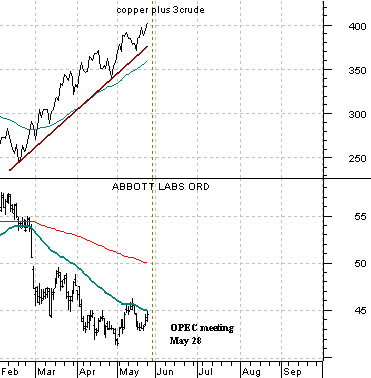
Below we show two comparisons between the sum of copper and crude oil futures (copper in cents added to three times crude oil futures in dollars) and the share price of Abbott Labs (ABT). The top chart is from 2003 while the lower chart is from the current time period.
We thought, given that ABT pushed back towards 45 yesterday, that we might as well show this comparison once again. The argument is that ABT will tend to decline when there is rather intensely focused cyclical strength. This was the case through into March in 2003 so when ABT finally popped back to the upside it indicated that the markets had reached a point where a cyclical pause was in order.
It could be that ABT spends the next month or two grinding lower but with an OPEC meeting due later this week we have to admit that our interest is piqued.
Equity/Bond Markets
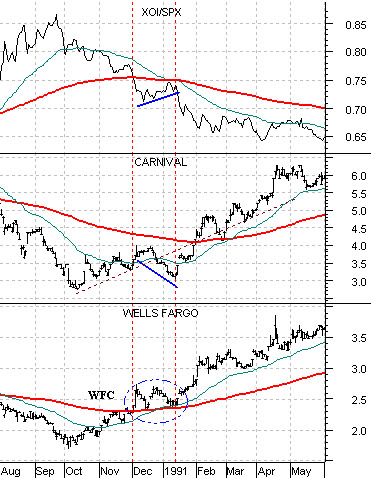
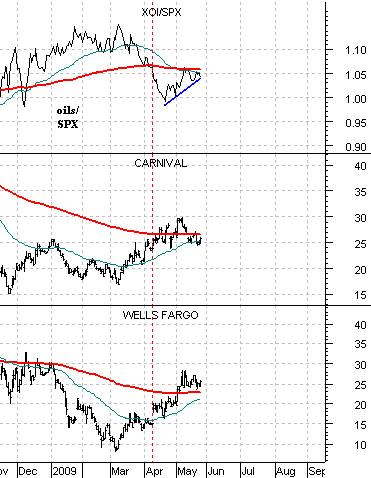
Below we show (once again) the comparison between the ratio of the oils (XOI) to the broad market (SPX) and the share prices of Carnival Cruise Lines (CCL) and Wells Fargo (WFC). The top chart is from 1990- 91 while the lower chart is from 2008- 2009.
We are focused on the XOI/SPX ratio relative to its 200-day e.m.a. line. The chart below shows that when the ratio initially declined below this moving average line in late 1990 it subsequently rallied back up to it before turning back to the down side in January.
The decline down and away from the moving average line marked the start of another bout of strength in the equity markets that carried both CCL and WFC to new recovery highs.
The chart below shows that from mid-April into late May this year the XOI/SPX has been working back up to its moving average line.
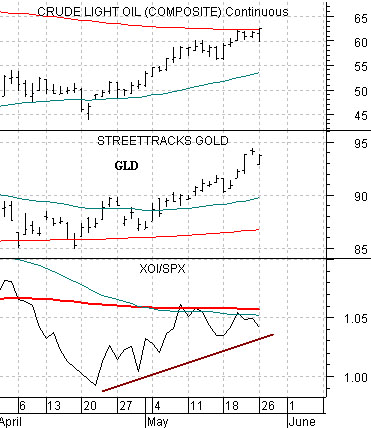
We sharpen our focus somewhat as we turn to the chart below of the Amex Oil Index (XOI)/S&P 500 Index (SPX) ratio along with the gold etf (GLD) and crude oil futures.
If history repeats somewhat so that the rally in the XOI/SPX ratio creates downward pressure in the equity markets then this pressure has gone with the rally from 45 up to 62 for crude oil and close to a 100 point rise in gold prices.
Our point is that there is still a fairly bullish outcome on the horizon but it depends in large part on flat to weaker energy and metals prices. Our view was that the XOI/SPX ratio would rally back up to its moving average line, peak as the 50-day crossed down through the 200-day, and then resolve lower. The only thing missing so far is the downward resolution…