In yesterday’s issue we attempted to explain that while trends tend to run quarter to quarter the start or pivot that initiates a trend may not show up until some later in the first month.
Our view (which may or may not have much to do with reality) is that the markets follow the path of least resistance with strength coming from and creating offsetting weakness with little regard for actual fundamentals. In other words… crude oil prices can be 145 today and 50 a few months later based on fairly minor changes in fundamentals and significant changes in momentum and trader psychology. Is crude oil ‘worth’ 145? Probably not. On the other hand it may not be ‘worth’ 40 or 50 either.
The point that we may or may not get around to making is that we are somewhat nervous about the current quarter. The trend has yet to be established and, as usual, will likely evolve as the next few weeks worth of U.S. jobless data comes in. Better jobs numbers push yields higher while supporting cyclical growth while weaker employment data pushes the trend back towards the deflationary spiral.
We will be watching with some interest the way the markets react to the next raft of quarterly earnings reports. The actual numbers are far less important that the reactions to these numbers. Blowout quarters that lead to stock price weakness suggests that all the good news has been priced in. Earnings below expectations followed by rising stock prices argues that the markets have been leaning too far towards a bearish outcome.
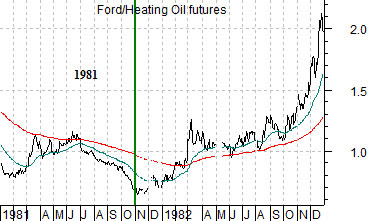
The ‘decade theme’ suggests that the broad trend for cyclical growth tends to repeat from decade to decade with different sectors providing leadership. The chart at top right shows the ratio between Ford (F) and heating oil futures from 1981- 82. The Ford/heating oil ratio ‘led’ the stock market’s recovery but did not bottom until the end of October in 1981.
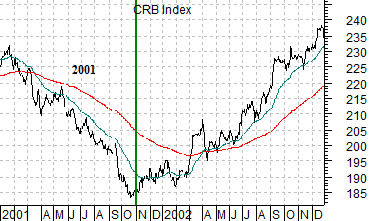
At middle we show the CRB Index from 2001- 02. Commodity prices led the recovery by turning higher around the end of October in 2001.
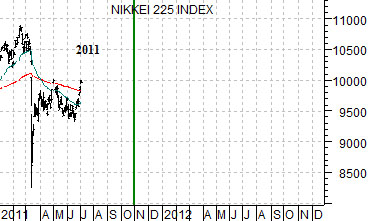
The final chart features Japan’s Nikkei 225 Index. Did Japan (representing the laggard cyclical sectors) bottom earlier this year? Is it already in a rising trend? Our ‘hope’ is that we are now onward and upward while our daily concern is that we may not reach the pivot point until next November.
Equity/Bond Markets
We are well aware that we are now arguing both sides of the market. If the cyclical trend digs in and gains traction we can always say that we were right. If the trend falters into the autumn we can also argue that this was exactly what we feared might happen. The problem with this is that there is a major difference between not being wrong and actually being right.
Point 1: The next time the cyclical trend starts to run it should include the laggard sectors. We are far enough away in terms of price and time from the 2008 melt down with earnings for the S&P 500 Index expected to reach new highs by year end to support a rising trend for yields and a broadening out of growth.
Point 2: The key words here are ‘the next time the cyclical trend starts to run’. This may have started at the end of June or it may not start until later this year.
Point 3: Long-term yields should turn higher up to a year before the Fed is forced by the markets to start tightening credit. What might come as a surprise is the fact that long-term yields bottomed last autumn. If the cyclical trend is strong enough to support a rising Fed funds rate then the next quarter should be cyclically relentless.
Does this make sense? Let’s try to show what we mean.
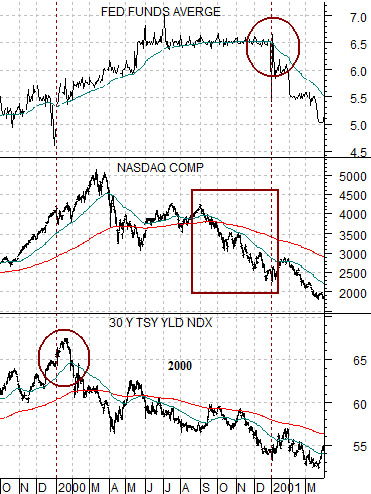
Below is a chart of 30-year Treasury yields, the Nasdaq Composite Index, and the Fed funds rate from late 1999 into early 2001. We are focusing on what happened in the year 2000.
At the start of 2000 long-term yields peaked and turned lower. A year later in January of 2001 the Fed started to drop the funds rate. In between these two points in time the Nasdaq started to collapse.
The argument is that long-term yields began to decline because growth was slowing even as investors were certain that growth must be accelerating. The sequence was initiated by the peak for long-term yields, confirmed by the break down of cyclical asset prices (i.e. Nasdaq), and eventually validated- a year later- by the Fed.
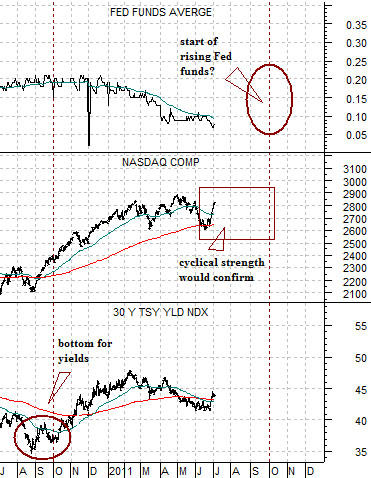
Let’s turn this pattern upside down just in case in works in reverse.
The bottom for long-term yields (so far) was reached around the end of the third quarter in 2010. In theory the Fed could be forced to start raising the Fed funds rate in August or September. What we are missing and, indeed, what we are flailing around trying to discern and explain… is the confirmation of the trend that should come from cyclical asset prices.
Now… to date the cyclical trend has been dominated by a weaker U.S. dollar. Fair enough. After all, the Fed funds rate is effectively 0% which provides incentive for money to move away from the dollar in search of higher returns. What happens if the markets come to the realization that we are only a few months away from U.S. yields swinging higher? What if the Nasdaq Comp. busts up through 2900 this quarter following this month’s earnings reports? Will tech-related strength and upward pressure on U.S. yields be enough to push the dollar higher? This, by the way, is one of the key points that we are struggling with as the markets chop back and forth early in the new quarter.