Interesting. We have now changed our first page topic for the third time and it is a rare day indeed when we gut and change a topic even once after it has been laid out. We suspect that this reflects a certain amount of indecision and uncertainty with respect to the markets…
Our thought is that the markets often do a very good job of providing misdirection. When everyone is focusing their attention in one direction a bull market can disappear just easily as an elephant or tiger on a magician’s stage.
So… with much of the focus on U.S. quarterly earnings and the recovery of the euro… our point is that if growth is going to slow it likely will do so in the market with rising short-term interest rates and rapidly tightening monetary policy. In other words… China.
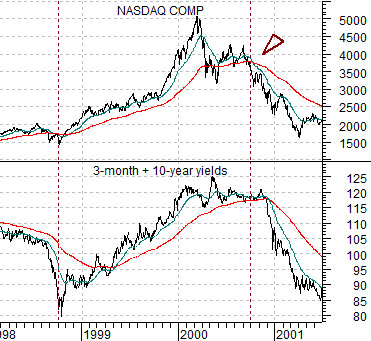
Below we compare the Nasdaq Composite Index and the sum of 3-month and 10-year Treasury yields from 1998 into 2001.
The argument is that when yields bottomed at the start of the final quarter of 2009 the tech and telecom sector was first and fastest out of the blocks. Two years after the low point in yields in 1998 the cyclical trend turned negative as the Nasdaq began to decline to the point where the 50-day e.m.a. line ‘crossed’ down through the 200-day e.m.a. line.
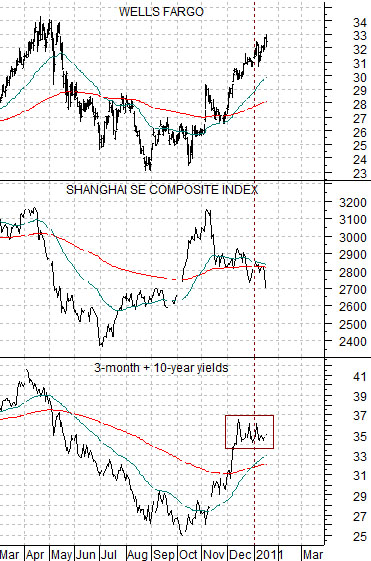
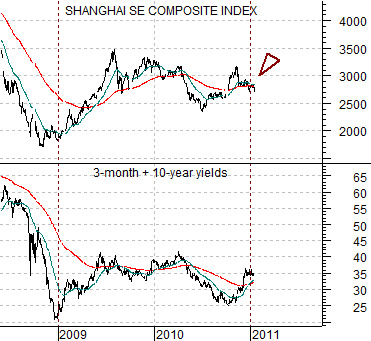
Below is a comparison between the Shanghai Composite Index from China and the sum of U.S. 3-month and 10-year Treasury yields. We suspect that this argument might be a bit more persuasive if we did something like meld U.S. long-term yields with rising Chinese short-term yields.
The chart detail that captured our attention has to do with the potential ‘crossing’ of the moving average lines for the Shanghai Comp. To the extent that China has led the recovery in a manner similar to the tech and telecom sectors back in 2000 this kind of weakness seems somewhat ominous. It will only be important, of course, if it starts to leak out from China into the other markets. Likely it will make sense to keep a close eye on both copper and bond prices in the days to come in case the Chinese equity market is the leading edge of a global growth slow down.
Equity/Bond Markets
Below is a comparison between Wells Fargo (WFC), the Shanghai Composite Index, and the sum of U.S. 3-month and 10-year Treasury yields.
Continuing on with our above point we wanted to show how dramatic the divergence between the U.S. recovery (yields and WFC) and the Chinese equity market really has become. The divergence may prove to be temporary with the Shanghai Comp. swinging back to the upside but the longer this runs- especially if it starts to show up in the bond market through falling yields- the more ominous it will appear.
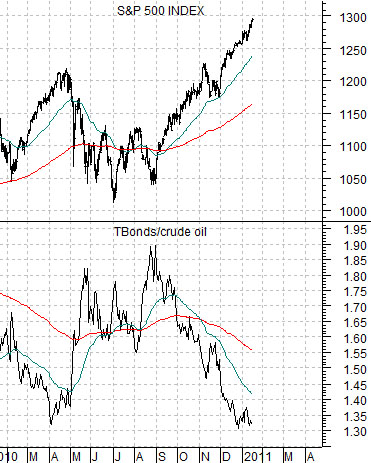
Below is a comparison between the SPX and the ratio between the U.S. 30-year T-Bond futures and crude oil futures.
Strong oil prices and weak bond prices have absolutely defined the trend for the equity markets over the past four or five months. As long as crude oil futures are grinding higher as bond prices move lower the trend for the SPX should remain nicely positive. Caution would be warranted, however, if the TBond/crude oil ratio manages to spike back up through its 50-day e.m.a. line in a manner similar to the end of April last year.
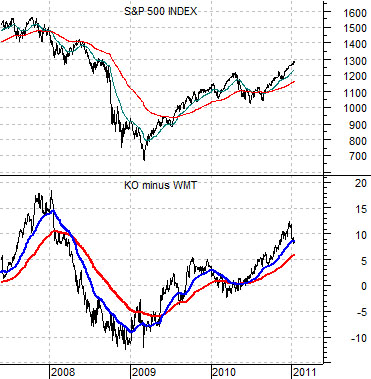
Last we feature a chart of the SPX and the price spread between Coca Cola (KO) and Wal Mart (WMT).
In recent years Coke has tended to rise relative to WMT when the equity market’s trend was positive. We continue to watch for indications of emerging relative strength from WMT as a potential sign of a trend change towards a more bearish outcome for the equity markets.