We have argued that we expect upward pressure on interest rates through into the second half of 2012 with the potential for the U.S. yield curve to flatten out in the vicinity of 4.5%. With 30-year yields already through 4.7% even as the Fed holds overnight rates close to 0% this is going to lead to a significant flattening of the yield curve.
Feb. 5 (Bloomberg) — Treasuries tumbled, pushing 10-year yields to the highest since May, as an unexpected drop in the jobless rate and data showing growth by factories and service industries fueled bets the economic recovery is gaining steam. Thirty-year yields had the biggest weekly increase since October as manufacturing also accelerated in Europe and China, making higher-yielding assets more attractive.
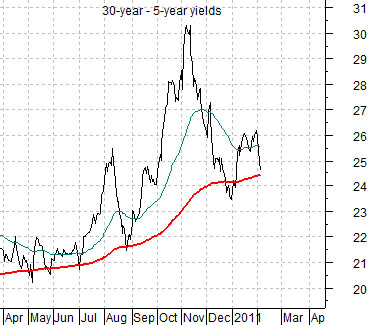
Below is a chart of the spread between 30-year and 5-year U.S. Treasury yields.
Our focus today is on the marginal decline last week in this yield spread. Note that it is still holding above its rising 200-day e.m.a. line but after reaching a peak in early November it does appear to be under some amount of downward pressure.
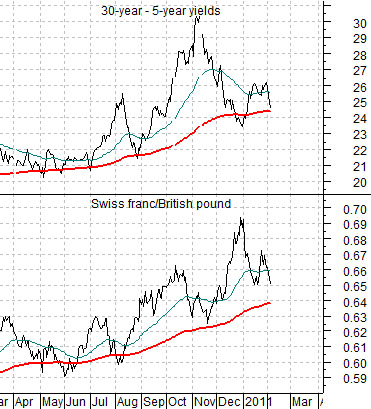
Below we compare the spread or difference between 30-year and 5-year yields with the cross rate between the Swiss franc futures and British pound futures.
We mentioned last week that we were warming up to the idea of strength for sterling versus the Swiss franc. The thought was that as a major financial center Britain would benefit from the gradual recovery in the banking sector while the franc- a destination for risk averse money flows- would start to weaken on a relative basis.
The argument is that there is a basic relationship between the yield spread and the cross rate. A declining yield spread would represent an improvement in the economic recovery and should be confirmed in due course by downward pressure on the franc/pound cross rate.
Obviously both the yield spread and cross rate remain above their respective 200-day e.m.a. lines but have the potential over time to resolve lower to confirm progress in the global economic recovery.
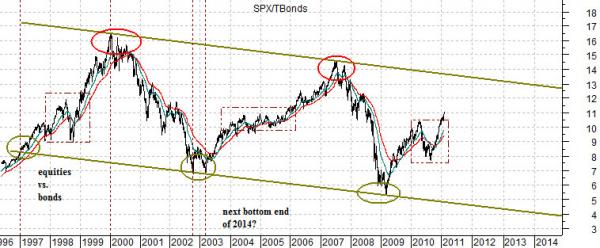
Equity/Bond Markets
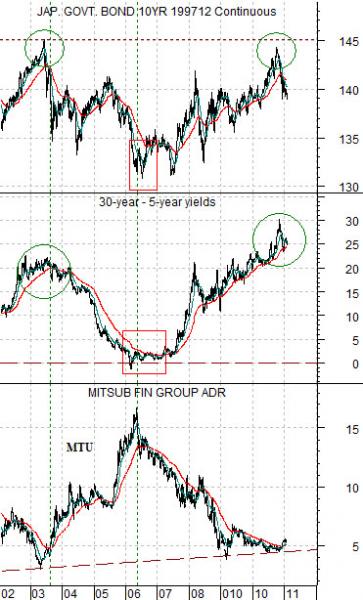
Below is a comparative view of the Japanese 10-year (JGB) bond futures, the spread between 30-year and 5-year U.S. Treasury yields, and the share price of Japanese bank Mitsubishi UFJ (MTU) from 2002 to the present time period.
The ongoing argument is that MTU should be at a cycle bottom when the Japanese bond market is at a price peak and… the yield spread is at a top. Notice that the small improvement in recent months for the share price of MTU has gone with a decline in Japanese bond prices and a minor correction in the yield spread.
Now… our argument is that in some respects 2010 was similar to 2003 in that both years marked the lows for MTU, the highs for the JGBs, and the top for the yield spread.
Peak earnings for the S&P 500 Index were made in the autumn of 2000. Following the collapse of the Nasdaq SPX earnings did not rise to new highs until the first quarter of 2004- close to a year AFTER MTU made its cycle bottom. According to Goldman Sachs the SPX is expected to surpass 2007’s peak earnings around the fourth quarter of this year which suggests that a cycle bottom for MTU late in 2010 would be somewhat appropriate.
Below is a chart of the ratio between the S&P 500 Index and the U.S. 30-year T-Bond futures.
There are three details that we wished to point out from this chart. First, the next top will likely be made with the ratio at or just above 13:1. If this goes with the SPX at, say, 1550 then the TBonds would be priced between 115 and 120 (close to today’s levels). Second, the ratio has been making bottoms every six years. If history were to repeat then the next low would be due around the end of 2014. Third, in both 1998 and 2004- 05 the recovery stalled somewhat. Chart-wise it appears that 2010’s Eurozone ‘crisis’ may have simply been a repeat of that tendency.
The point is that if the channel holds we could see a return to the old highs for the SPX with the long end of the bond market flattening out around current levels as short-term yields rise to flatten the yield curve. A cyclical peak into 2012 would be somewhat appropriate with the potential for downward pressure through 2014.