Aug. 20 (Bloomberg) — Canada’s dollar touched the strongest level this week, erasing earlier losses, after Goldman Sachs Group Inc. advised purchasing the currency against its U.S. counterpart.
The Canadian currency, nicknamed the loonie, gained for a third day as Goldman recommended in a research note selling the U.S. dollar and buying the Canadian because of the loonie’s “strong exposure” to oil.
It is always nice to be right and much less enjoyable to be wrong but there is a difference between being wrong and staying wrong. In other words when you are trading with the trend life is sweet while the markets appear both simple and rational but when you are on the wrong side of the trend misery and stress are your constant companions.
We have been known to dig in an fight the trend for extended periods of time so we have a passing acquaintance with markets-related anxiety. Each time this happens we utter fervent promises that next time things will be different. When the markets begin to make us sufficiently unhappy we need to recognize that we are wrong and either get right with the trend or, at minimum, hie to the side lines for a re-think.
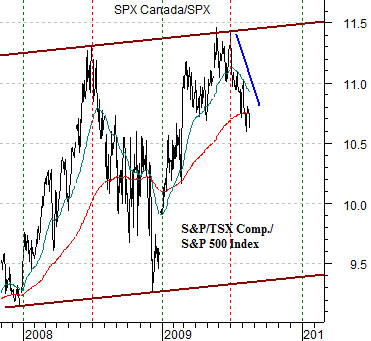
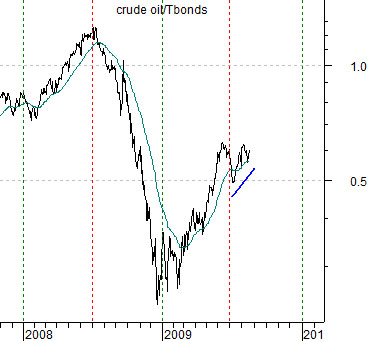
Our problem at present is that we still can’t figure out if we have nailed the trend change or are in the process of getting steam rolled. To explain we have included at top right a chart of the ratio between the Canadian and U.S. equity markets (S&P/TSX Composite Index divided by S&P 500 Index) and at bottom right a chart of the ratio between crude oil futures and U.S. 30-year T-Bond futures.
Yesterday- as noted above- Goldman suggested buying the Cdn dollar because of its exposure to crude oil. A simple enough statement even as it cuts right to the heart of the matter. Our argument has been that the markets are shifting trends from ‘strong oil, copper, and interest rates’ through the first half of the year to ‘weak oil, copper, and interest rates’ during the second half. Our thesis is that the Cdn/U.S. equity markets ratio should bottom in December and peak around the end of June while the same should be true for the ratio between crude oil futures and the U.S. 30-year T-Bond futures.
Our point? If we use the Cdn/U.S. equity markets ratio as an indicator of whether we are right or wrong… we are most definitely on the correct side of the trend. On the other hand the crude oil/TBonds ratio is still pushing higher and the Canadian dollar remains near its highs suggesting at least the possibility that we could be dead wrong.
Equity/Bond Markets
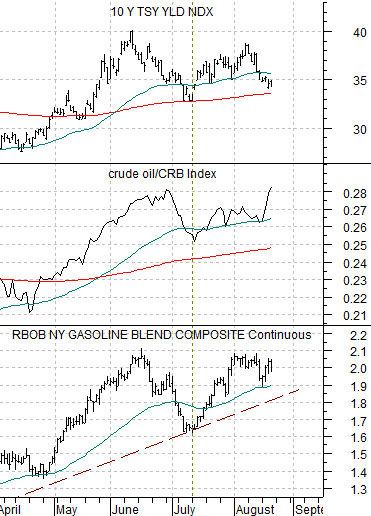
In keeping with our ‘right or wrong’ theme today we show at right the yield index for 10-year U.S. Treasuries, the ratio between crude oil and the CRB Index, and gasoline futures.
Our argument is that rising gasoline prices and strength in the crude oil/CRB Index ratio should go with escalating long-term Treasury yields. Given that yields are still below the June peak while gasoline futures hold just below the recent highs we can argue that- through yesterday- our thesis had not been blown out of the water.
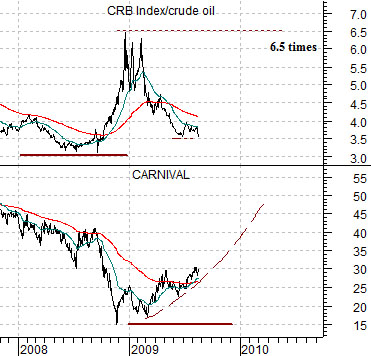
The ratio of crude oil to the CRB Index defines crude oil’s relative strength compared to commodity prices in general and has served as an integral part of one of our key chart-based themes.
Below we show the inverse or reciprocal of this ratio- the CRB Index divided by crude oil futures- along with the share price of Carnival Cruise Lines (CCL) from late 1997 into 2000.
The argument was that major peaks in the CRB Index/crude oil ratio precede major tops for the autos and airlines theme (including Carnival) by close to a year. When crude oil prices reached a cycle low at the start of 1999 it marked the highs for the CRB/crude oil ratio but the chart shows that Carnival’s share price did not break to the down side for close to a year.
The ‘leap’ that we have made is that this relationship works from both directions. If peaks for the ratio lead to cycle tops for Carnival then bottoms for the ratio should mark cycle bottoms for CCL’s share price. Fair enough- we show the current situation at bottom right.
The entire argument is based on the premise that the relative strength highs for crude oil were reached last year. If the CRB Index/crude oil ratio continues to decline to new lows this year- proving us ‘wrong’- then there is a definite chance that the recovery for the autos and airlines will be pushed out at least a year into the future.