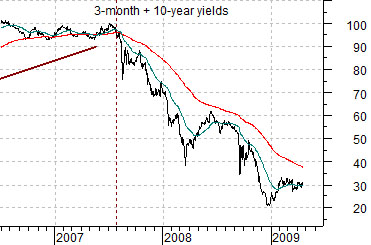
We are going to return to the 2-year lag argument today.Below are the same three charts that we showed on Friday with the only difference being that we are using somewhat shorter time periods for the comparison.
The argument is that there is a lag between changes in interest rates and cyclical growth. Put another way the reason that the economy does not spring back to the life the first time that the Fed cuts interest rates is that monetary policy works with a lag. The same is also true for increases in interest rates. In fact… one of the most bullish things that can happen during a markets cycle is the initial rate hike by the Fed. The stock market is usually very strong from the first rate hike through the last rate hike. The challenge is trying to determine which, in a series of interest rate increases, is going to be the one that breaks the markets’ back.
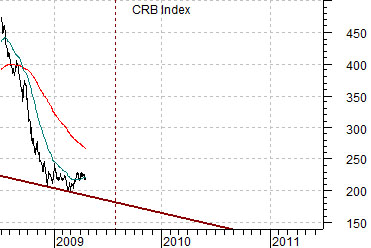
In any event our chart-based argument suggests that changes in interest rates are somewhat less important that the time period involved. When interest rates swing higher the next down turn for cyclical growth as represented by commodity prices will begin about two years later. When interest rates turn lower the next upturn for commodity prices will tend to start close to two years into the future.
On Friday we showed that rising interest rates from the spring of 2004 led to negative cyclical growth beginning in the first half of 2006. The commodity markets managed to resolve higher into 2008 until collapsing back ‘on trend’ last year.
Our focus today is more on what should happen next. The trend towards lower interest rates began during the summer of 2007 so if the chart-based argument were to hold literally to ‘the month’ then we still have at least a quarter’s worth of cyclical pressure to wade through before we start to see the beginnings of a tail wind behind economic growth.
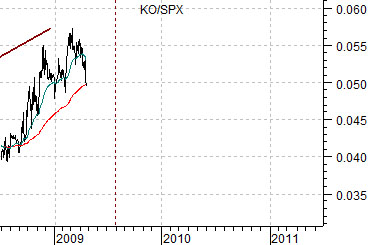
With seasonal strength supporting the cyclical sectors into May the ratio between Coca Cola (KO) and the S&P 500 Index (SPX) has pulled back to the rising 200-day e.m.a. Our view is that we are going to see another bout of cyclical weakness from May into August that will push the KO/SPX ratio higher one last time while potentially taking the CRB Index to new lows. Once we get through into August, however, we would expect the cyclical sectors to start showing a bit more traction.
Equity/Bond Markets
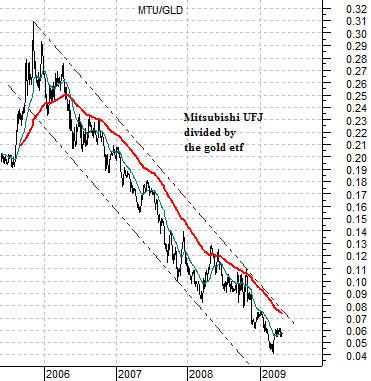
Belowis a chart of the ratio between Japan’s Mitsubishi UFJ (MTU) and the gold etf (GLD).
The argument- based on the 2-year lag- is that rising interest rates in 2004 turned cyclical strength negative in 2006 while falling interest rates in 2007 should turn cyclical strength positive during the second half of 2009. While we tend to use commodity prices to represent cyclical growth… we can make a fairly strong argument that the MTU/GLD ratio has been more representative.
The point? We still might have another quarter to slog through before we get to the other side of this mess but the basic argument would be that the MTU/GLD ratio should come out of 2009 in a more positive manner.
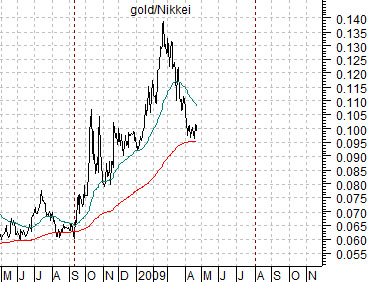
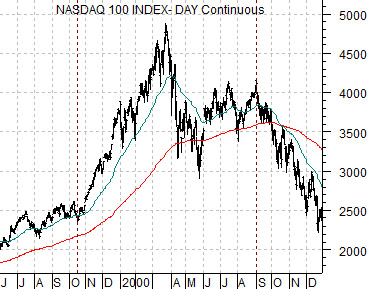
Belowwe show the ratio of gold futures to the Nikkei along with the Nasdaq 100 Index (NDX) futures from 1999- 2000. The charts have been offset by one month so that March of 2000 for the NDX futures is lined up with February of 2009 for the gold/Nikkei ratio.
The point? In a perfect world we return to a stronger Nikkei and weaker gold trend around the start of August this year.
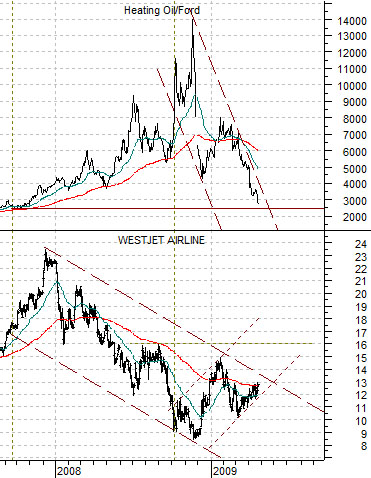
Below we compare the ratio between heating oil futures and the share price of Ford (F) with Canada’s WestJet (WJA on Toronto). The argument was that when the heating oil/Ford ratio peaks- as it did during the 4th quarter of 2008- the ‘base trend’ for the equity markets turns positive. We are using WJA to represent the broader concept of cyclical growth that is not tied directly into the production of raw materials. In other words an economically sensitive company that benefits from lower rather than higher energy prices.