If you have been around the markets for more than a few months you have probably stumbled across the adage to ‘sell in May and go away’. The strange thing is that it actually works although not exactly in the manner that most expect.
From our point of view ‘sell in May and go away’ reflects the way the recurring seasonal trend impacts the markets. On a seasonal basis the perception of growth seems to bottom around the month of November and top some time around May or June. The twist is that there are years when stronger growth can be a negative and years when weaker growth is viewed as a positive. This is especially true if the markets are overly focused on the spectre of rising inflation.
In any event… over the past few years we have argued on many occasions that long-term Treasury yields have been rising through the first half of the year and declining through the second half. We have also suggested that the ‘driver’ behind upward pressure on yields has been energy and metals prices. In other words when ‘the trend’ is dominated by commodity price strength then rising raw materials prices will tend to push yields higher.
In the post-2008 time frame the questions that come to mind are as follows: Is the seasonal trend strong enough to push yields higher through the second quarter of this year? If so, will the markets return to the weak dollar/strong commodity price theme or will sectors like ‘tech’ swing to the forefront?
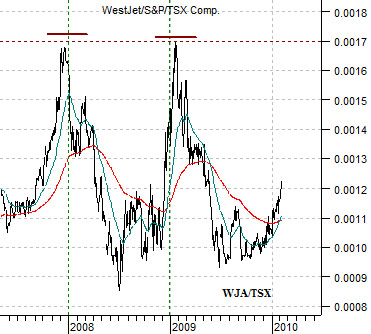
Below is a chart of the ratio between Canadian airline WestJet (WJA on Toronto) and Canada’s S&P/TSX Composite Index. While the airlines are ‘cyclical’ when the trend is focused on ‘strong energy prices’ the airlines will tend to be under pressure through the first half of the year and stronger during the second half. Put another way… this explains why the ratio between WJA and the TSX tended to peak around the end of the year.
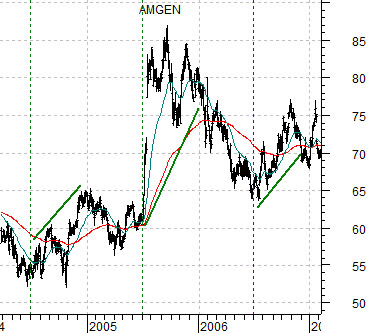
Next we show biotech giant Amgen (AMGN). Notice that AMGN tended to be lower through the first half of the year while commodity prices pushed higher and then stronger during the second half once commodity prices and yields began to weaken.
Equity/Bond Markets
Quickly… if the trend has not changed then look for the energy and basic materials sectors to dominate through the second quarter. Our sense is that this may be the first year in quite some time with new leadership through the front half of the year which explains our current fixation on the semiconductor stocks.
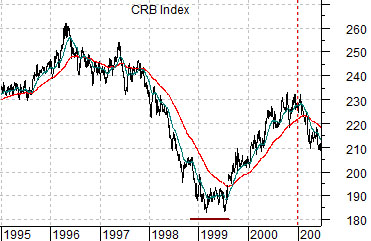
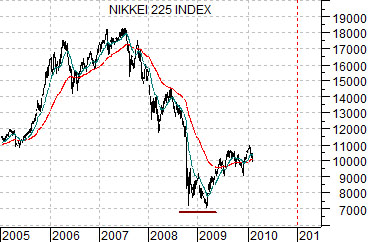
Below we show the CRB Index (commodity prices) from 1995 into 2001 and Japan’s Nikkei 225 Index from 2005 to the present day.
Commodity prices dominated into 1980, the Nikkei was a clear winner into 1990, while the Nasdaq rose to a top in 2000. Commodities, Japan, tech, followed by commodities once again. Our recurring thoughts are that the next decade might include a remarkably recovery for Japanese asset prices and that the Nikkei today is potentially in a similar position to commodity prices ten years ago at the start of the last decade.
If the chart comparison at right is at all instructive then the rally could continue through to the end of the year.
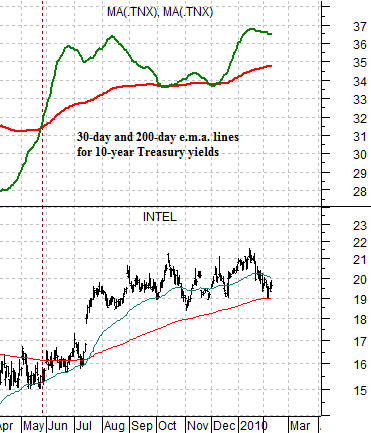
Below we compare Intel (INTC) to two moving average lines related to 10-year U.S. Treasury yields. The argument was that yields tend to lead the market in general and Intel in particular. As long as the moving average lines are not in imminent danger of ‘crossing’ we are inclined to remain positive on INTC.
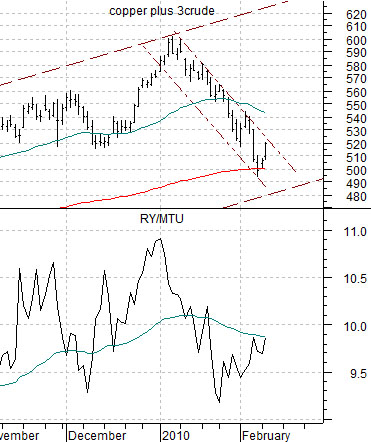
Last is a comparison between the sum of copper and crude oil futures and the ratio between Canada’s largest bank (Royal Bank- RY) and Japan’s largest bank (Mitsubishi UFJ- MTU). In a stronger commodity price trend the banks of commodity producing countries will outperform. In a flat to weaker commodity price trend the situation should reverse with Japanese banks assuming leadership within the financial sector.