After reviewing a host of charts and perspectives we often come away with a clearer sense of what the markets are up to. There are even times when we gain a real conviction about how the future is going to unfold. Unfortunately… today is not one of those days.
If there is a theme throughout today’s issue it likely has something to do with ‘suggestion’. The suggestion of potential, the suggestion of possibility, and the suggestion of one or more outcomes. In a perfect world we will be back to a more certain state of mind within a day or so but for now as we wade deeper through the release of quarterly earnings we will have to accept that there is a reasonable chance that our sense of disquiet has something to do with the fact that this is an uncertain time rife with cross currents and offsetting pressures.
If you have managed to stay with us this far perhaps we should cut to the chase. As we write this we have the sense that at best we are going to show a few charts with interesting messages even though we suspect that we aren’t going to be adding anything new or conclusive to our stack of theses and arguments. So… here goes.
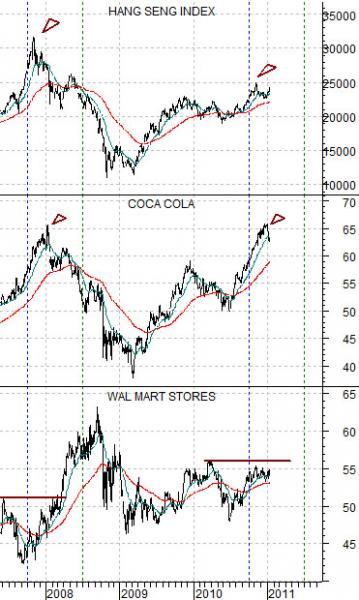
Below is a comparison between the Hang Seng Index from Hong Kong, the share price of Coca Cola (KO), and the share price of Wal Mart (WMT).
We can show any number of perspectives that clearly argue that today is quite different than January of 2008 yet this fairly simple comparison suggests that there may be a broad similarity.
Around the month of November in 2007 the Hang Seng Index touched a cycle peak. In January of 2008 the share price of Coca Cola reached a high. As these two events were taking place the share price of Wal Mart was making a bottom on the way to breaking to new recovery highs during the first quarter of 2008.
We would be happy to shelve this particular perspective if it would simply stop following the sequence set out in 2007- 08. Notice that the Hang Seng Index reached a high in November of last year with Coke pushing to what so far has been a cycle peak this month even as Wal Mart works through a price bottom. If history were to repeat this would be about the time when energy prices started to cause problems by ramping higher…
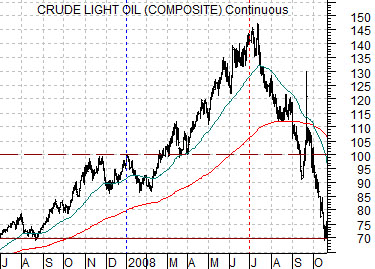
Continuing on with our above argument we have included a chart of crude oil futures from 2007- 2008 below.
As mentioned there are any number of differences between today and January of 2008 but we are going to focus on a few of the similarities.
Crude oil futures prices bottomed in August of 2007 around 70 before rising to 100 to end off the year. After correcting lower in January crude oil prices pushed to new highs into late February before driving up through 145 into July.
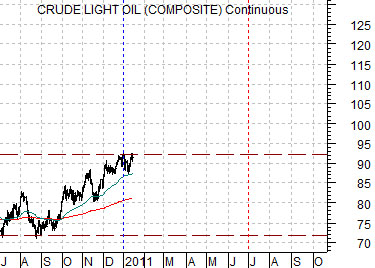
At middle we have included a chart of crude oil futures from July of last year through the end of this past week.
Notice that once again crude oil prices made a bottom very close to 70 into late August before grinding higher into the end of the year. While the peak to date is below 100 the trend still appears visually quite similar.
If history were to repeat the Hang Seng Index would continue to decline along with the share price of Coca Cola as Wal Mart- serving as the destination for money heading into defensive themes- would resolve to new recovery highs in response to crude oil futures moving above 92 later this quarter on the way to a mid-year price peak. We would be looking for second quarter strength from Amgen (which tends to rise in front of the U.S. dollar) followed by dollar strength towards the end of the second quarter which would serve to cap the rally for energy prices.
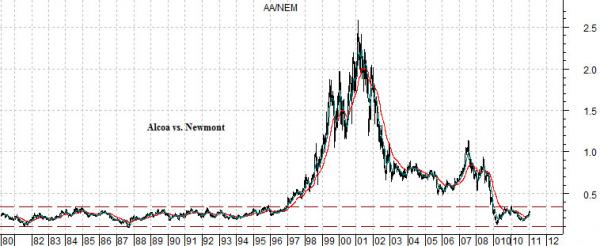
Below is a long-term view of the ratio between Alcoa (AA) and Newmont NEM).
This is an interesting chart because it suggests that the relationship between the aluminum producers and gold producers has finally come back into some form of balance. The ratio held within a fairly narrow band from 1980 through 1996 before AA exploded to the upside on a relative basis. After close to a decade of rising gold prices the ratio has returned to its old trading range suggesting, we suppose, that gold prices have finally caught up with earlier strength from the other asset price sectors.