We returned to the 2-year lag argument last week… for a reason. We wanted to lay out the foundation of the argument and show how it had tended to work so that we could take it a step further and apply it to the current situation. However, as usual, we will get to our point in a somewhat circular fashion.
In the good old days… the Fed set the direction for short-term interest rates and while one or more central banks might lean against the wind from time to time the overall trends were similar. In recent years the situation has become somewhat muddied as the Eurozone, China, India, and Brazil have risen in relative importance.
The argument is that there is a 2-year lag between changes in the direction of interest rates and the impact on the cyclical trend. The question is… what happens when European and/or Japanese rates diverge from the trend for U.S. rates?
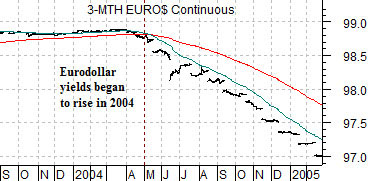
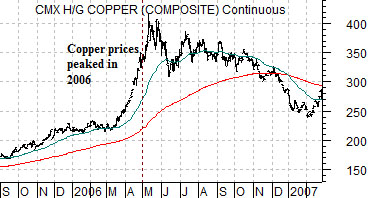
At top right is a comparison between 3-month eurodollar futures (a falling price trend represents rising U.S. yields) and copper futures. We are showing eurodollar prices from 2003- 05 and copper prices from 2005-07 to incorporate the 2-year lag.
The point is that U.S. yields began to rise in May of 2004 while copper prices peaked in May of 2006. Fair enough.
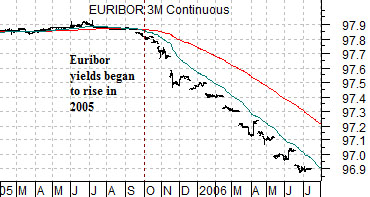
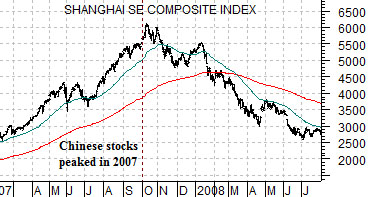
Below right is a chart of 3-month euribor futures (a falling trend represents rising Eurozone yields) and the Shanghai Composite Index. Once again we have created a 2-year lag by showing European short-term debt prices from 2005- 06 and Chinese equities from 2007- 08.
In this instance Eurozone yields began to move higher in October of 2005 while the Shanghai Comp. moved to a peak in October of 2007.
The argument is that the 2-year lag tends to work. The twist is that when U.S. and Eurozone yields move upwards at different points in time it appears that the cyclical trend becomes somewhat ‘split’. We had peak cyclical momentum (copper and yields) into 2006 and then a fairly brisk rotation into an assortment of new themes including the Asian equity markets that created a second top into the final quarter of 2007. From there growth began to weaken even as energy prices moved higher into the middle of 2008.
Equity/Bond Markets
So… in the previous cycle U.S. yields turned higher in the spring of 2004 while Eurozone yields remained at the lows until late 2005. This divergence of roughly 18 months may have led to a sort of ‘multi top’ for the cyclical theme that went with copper prices moving to a high in 2006 even as the Asian equity markets powered upwards for much of 2007.
We mention this because… it is happening once again. Only in reverse.
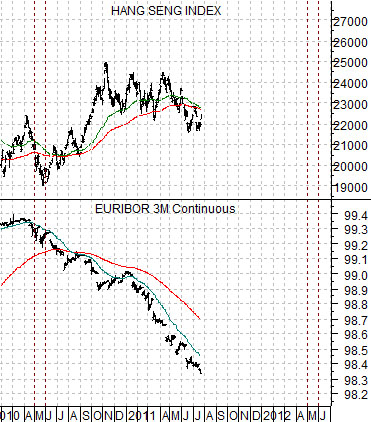
The chart at right compares the Hang Seng Index from Hong Kong and 3-month euribor futures.
At the end of last week we tossed in an unexplained comment with regard to the Hang Seng Index. We wanted to show exactly where our logic came from. The comment was that we expected the Hang Seng Index to rally back to the moving average lines and remain fairly strong into the spring of next year.
The chart at right shows that 3-month euribor futures prices began to trend lower in May of 2010. Short-term Eurozone interest rates therefore began to rise in May of last year.
In terms of the 2-year lag this would suggest that the cyclical trend should remain quite strong into May of next year and given that the Hang Seng Index tends to trend with the cyclical trend… it made sense to us that this market would survive the recent pressures and resolve back to the upside.
We are not going to argue that there is a 2-year lag between U.S. yields and copper and a similar lag between Eurozone yields and Chinese equities. That would be too simple. It may be that copper keys off of the first major economic power to raise rates with Asian equities lagging. Or not. All we can really write is that the last 8 or 9 months before the peak in copper prices in 2006 and the Shanghai Comp. in 2007 were especially strong (i.e. both more than doubled in price) and this is the time period within the lag (Eurozone yields to the Hang Seng Index) that we are entering into this summer. If the cyclical trend is going to go parabolic… it should do so from the autumn of this year into next May.
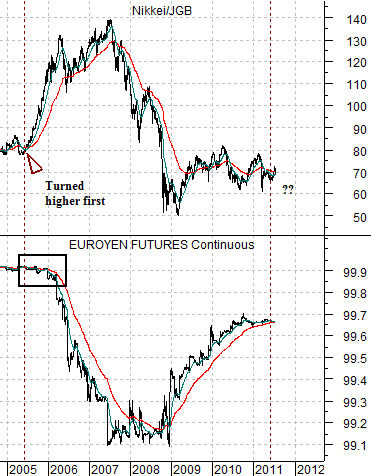
At bottom right is a comparison between 3-month euroyen futures and the ratio between the Nikkei 225 Index and the Japanese 10-year (JGB) bond futures.
The premise is that the Nikkei has tended to rise when Japanese bond prices are moving lower. This creates a version of the cyclical trend based on the ratio between Japanese equities (Nikkei) and bonds (JGB).
U.S. short-term yields turned higher in the spring of 2004. European yields began to rise in the final quarter of 2005. Japanese yields really began to fall around the end of the first quarter in 2006.
Our thought was that ahead of the decline in euroyen prices (rising yields) the Nikkei/JGB ratio began to power higher. If this tendency persists then one can’t wait for Japan to start to raise yields to know that its economy is strengthening because the equity and bond markets will have been trending- hard- for months or quarters before this begins. If we are in the portion of the cycle that fits with all of these arguments then it is time for the Nikkei/JGB ratio to start driving higher.