It is often said that those who do not learn the lessons from history are doomed to repeat them. Fair enough. To a point.
One of our views is that the markets move in cycles and that these cycles are often long enough to look very much like trends. In other words prices rise to reflect an excess of demand over supply until demand is cooled or supply is sufficiently increased. If the process takes long enough investors tend to believe that it is a trend which leads to the all too human tendency of extrapolation.
Our point is that over long periods of time each sector gets to take a turn. Following a lengthy period of outperformance by pharma stocks or consumer products makers the markets will bid prices up to the point where valuation levels are stretched before shifting gears over to commodity prices and commodity cyclicals. After a decade or so everyone will know with utter certainty that commodity prices can only go higher which sets the stage for a long period of price underperformance.
In any event… back to our initial topic today. Energy prices were strong and rising from 2007 into 2008 as the U.S. dollar declined. This trend led to a collapse of the banking system and a chaotic crumbling of the equity markets. If we were to learn a lesson from history then we should fear any trend that included exceptional energy price strength.
Unless… of course… the bond market tells us not to.
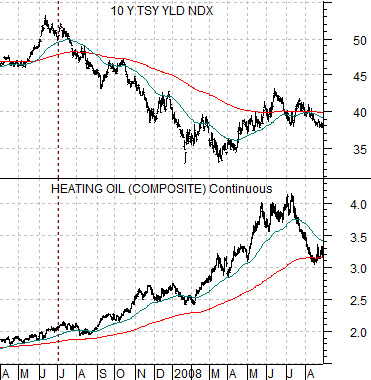
Below is a comparison between 10-year Treasury yields and heating oil futures from April of 2007 into August of 2008.
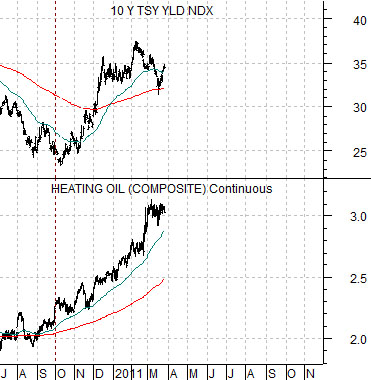
Next up we feature the same comparison starting in July of 2010 and running to the current time frame.
The key difference- so far- can be seen through the reaction of the bond market to rising heating oil prices. As heating oil futures started to rise from the 2.00 region in the summer of 2007 the bond market reacted by pushing long-term yields lower. This was the bond markets’ way of letting us know that a growth problem was developing. With the exception of a short-term- so far- correction in yields to start the year the bond market has reacted in a cyclically bullish manner by driving yields upwards in response to energy price strength over the past few quarters. In general… if there is one market that one shouldn’t argue with it is the bond market. To date the bond market is still suggesting that growth is positive and expanding even as energy prices rise.
Equity/Bond Markets
We are going to run through a couple of chart comparisons that we follow even if, to the best of our knowledge, they have never graced the pages of the IMRA.
This will take a bit of explanation even if the underlying concepts are likely quite simple.
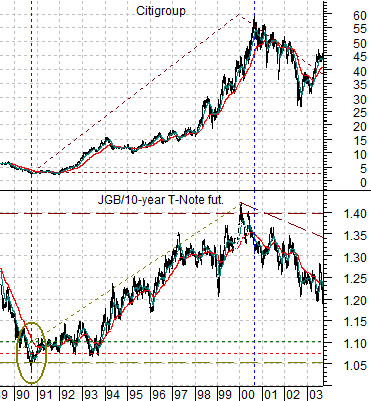
Below is a chart of the share price of Citigroup (C) and the ratio between Japanese and U.S. 10-year bond futures from 1989 into 2003.
The first point is that the Japanese bond futures (JGB) were stronger than the U.S. 10-year T-Note futures from 1990 into 2000. In other words the ratio between the two trended higher for a full decade.
From 1990 into 2000 there was a powerful deflationary trend emanating out of Japan that went with falling interest rates and rising bond prices. This trend not only helped keep U.S. long-term yields lower than they might have otherwise been but also led to a flow of money away from Japan into U.S. assets.
The point is that as deflation gripped Japan post-1990 it created an upward trend for Japanese bond prices which, in turn, helped drive U.S. financial assets higher in price.
The end result of the 10-year rising trend for the JGB/T-Note ratio was a 10-year rising trend for the share price of Citigroup (C).
Once investors started to extrapolate the trend… it changed, as trends tend to do, into a cycle.
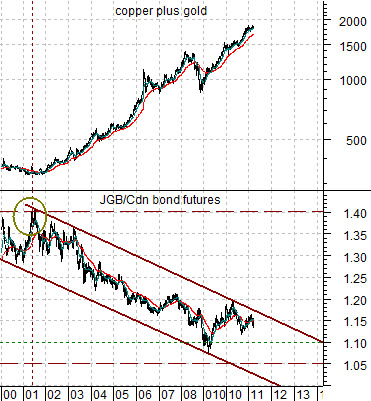
Below we show a comparison between the ratio of Japanese to Canadian bond futures and the combination of copper (in cents) plus gold (in dollars) from 2000 to the present day.
After a decade of U.S. financial asset price strength and steady outperformance by Japanese bond prices the trend ran into a valuation problem in 2000. The only thing for the trend to do was reverse course so that other markets could ‘catch up’.
Now… one might think that during a decade dominated by rising commodity prices and rising commodity currencies there would be downward pressure on the bond markets of commodity producing countries as all that growth and economic expansion led to rising interest rates. Not so.
The chart shows that for the past decade the Canadian bond market has actually outperformed the Japanese bond market. The chart shows that even in the face of a debilitating deflationary trend in Japan and marked economic strength in Canada… the Japanese bond market declined by 20% to 25% in price relative to Canadian bonds. Instead of the trend pushing U.S. financial asset prices higher- as was the case during the 1990’s- the trend shifted to real asset prices with a definite focus not only on energy but also metals.
The point, we suppose, is that sooner or later the commodities markets will reach a point similar to the Nasdaq and S&P 500 Index in 2000. This may well go with an upward reversal in the JGB/Cdn bond futures ratio or, quite possibly, a break below the original starting point in 1990. If the latter proves to be the case then we could see a shifting of deflationary pressure away from Japan towards the commodity producers as Japanese asset prices rise for the next ten or so years.