Quick note: We are going to be AWOL again from Friday through all of next week. We will send out an IMRA issue for Thursday and then it is off to a series of high-level meetings (tequila and scuba diving but not, of course, at the same time) at the center of the financial world (south of Cancun, Mexico) in an attempt to solve the current state of crisis (by not thinking about it for 10 days).
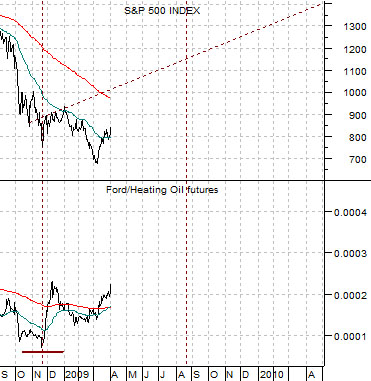
Below we show two charts of the S&P 500 Index (SPX) and the ratio between the share price of Ford (F) and heating oil futures. The top chart runs from September of 1981 through April of 1983 while the lower chart begins in September of 2008.
We have done this argument on a few occasions in the past but this is probably a good point in time to go back over it once again. The idea was that when the Ford/heating oil futures ratio makes a bottom it initiates a rising trend for the equity markets. In other words following a major commodity price cycle that ravages the U.S. economy and inevitably creates the impression that the autos are all going to go bankrupt there will be a point in time when energy prices will become weaker than the share price of Ford. In other words the Ford/heating oil ratio will bottom and when this happens it will mark the start of a rising trend for the S&P 500 Index.
We have also argued that when economic growth reaches an extreme- both positive or negative- there is a lag between the start of a rising or falling trend and actual rising or falling stock prices. The easiest way to explain what we mean by this is to return to the chart second below.
The Ford/heating oil futures ratio bottomed in November of 1981 but the stock market did not bottom and turn higher until August of 1982. The rising trend began in late 1981 even prices continued to decline for an additional 9 months.
Our argument this year has been that the base trend for the S&P 500 Index turned positive back in November of 2008 which simply means that we are now within ‘the lag’ and if history repeats this will mean that stock prices will remain under pressure into the second half of this year. In a perfect world the lag extends through into August after which time the equity markets would be expected to kick sustainably higher.

Equity/Bond Markets
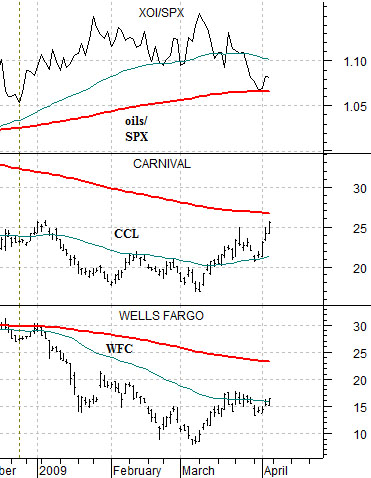
Below we show our comparison between the ratio of the Amex Oil Index to the S&P 500 Index (XOI/SPX) to the share prices of Carnival (CCL) and Wells Fargo (WFC).
The argument- once again- has been that a sustained equity markets rally will only begin once the XOI/SPX ratio starts to decline and when this ratio is ready to break down below its 200-day e.m.a. line (red line on the chart) the share prices of CCL and WFC should be ready to push above their 200-day e.m.a. lines.
We have been following this relationship for months (and months). The recent decline in the XOI/SPX ratio has indicated that there is at least some reason to be near-term hopeful. Ideally the ratio breaks to new lows as gold prices tumble and the financials strengthen.
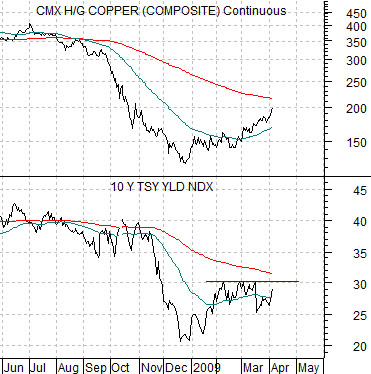
Below we have included a fairly simple comparison between copper futures and the yield index for 10-year U.S. Treasuries.
The idea is that copper prices trend with long-term Treasury yields. In other words rising copper prices go with rising yields while falling copper prices go with downward pressure on yields. Fair enough.
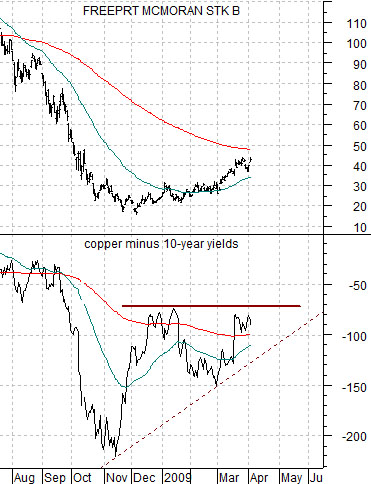
Below right we have included a twist on this argument. The chart compares the share price of copper producer FreePort McMoRan (FCX) with copper (in cents) minus 10-year yields. If copper prices were, for example, 2.00 (200) and 10-year yields were at 2.5% (250) the spread would be -50.
The argument goes something like this: Copper and yields rise together but the base metals stocks do better when copper is rising faster than yields. In other words if yields are stuck below 3.0%- as they have been since February- and copper prices are rising then the spread will push higher which, in turn, will support rising mining stock prices. Stronger copper prices are a positive but only during those periods of time when copper prices are able to push upwards at a faster pace then interest rates.