At the end of last week the Japanese yen, Swiss franc, and gold declined in price. We were encouraged. Somewhat.
April 1 (Bloomberg) — Gold declined the most in two weeks on speculation that the Federal Reserve will tighten U.S. monetary policy, curbing demand for the precious metals as alternative investments… Last week, gold climbed to a record of $1,448.60 as fighting in Libya, Japan’s nuclear crisis and European-debt concerns boosted demand for an investment haven.
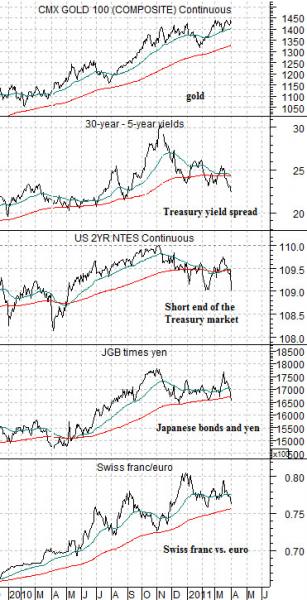
Our view has been that the offsets to pressures on the banking system have been the rising trends for gold, the Swiss franc, Japanese yen, short-term bond prices, and yield spread.
The argument is that once the economic recovery has progressed and expanded to the point where some or most of the ‘slack’ has been taken up we will start to see a reversal in the trends within the markets. In other words sectors such as gold, the yen, franc, and yield curve will peak and turn lower. This should mark the start of a ‘catch up’ for the laggard banks.
The chart below compares gold futures with the spread between 30-year and 5-year Treasury yields, the U.S. 2-year T-Note futures, the combination of the Japanese 10-year bond futures (JGB) times the Japanese yen, and the cross rate between the Swiss franc and euro.
Since late 2010 the 2-year T-Note futures have declined along with the yield spread. In recent days the Swiss franc has started to weaken somewhat against the euro while both the yen and Japanese bond futures ended last week to the down side. Gold prices have remained stronger on an absolute basis although when viewed in relation to the CRB Index gold prices have falling over the past 5 to 6 months.
The point is that the economic recovery that began around the time that weekly U.S. jobless claims peaked in March of 2009 is now more than two years old. Over the past quarter or two a weaker trend has begun to show up in a number of the ‘offset’ sectors but as the chart of gold futures attests… the process of finding true economic ‘traction’ remains a work in progress.
Equity/Bond Markets
The first quarter of 2011 was definitely chock full if crises. The issue that we are struggling with has to do with the length of time that the markets are prepared to trade off of the various crisis trends.
The argument has been that crisis trends often run for one quarter while in recent years the markets have found new and imaginative ways to push energy prices higher over the first two quarters of the calendar year. In other words… a case can be made that we will return to a somewhat weaker energy trend early this month while we can also make a reasonable case for a two-quarter trend that will extend through into the middle of the year.
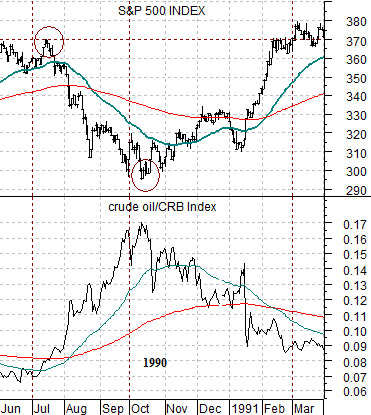
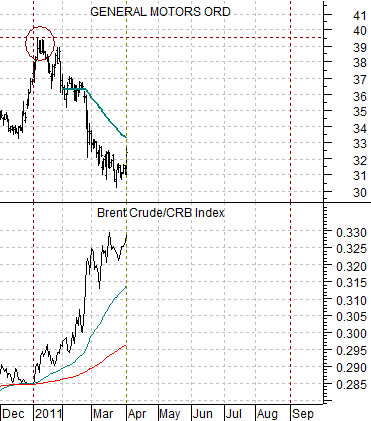
To get a sense of how this may play out we have constructed a comparison between General Motors (GM) and the Brent crude oil futures/CRB Index ratio (bottom right) and are following its progression within the context of the comparison between the S&P 500 Index (SPX) and the crude oil/CRB Index from 1990. Our thought was that while the current problems are undoubtedly serious… we suspect that they pale in comparison to the pre-Gulf War conditions in 1990.
In any event… our thought was that if, as, or when GM closed above its 50-day e.m.a. line then we may be out of the woods and into a sustainable period of recovery.
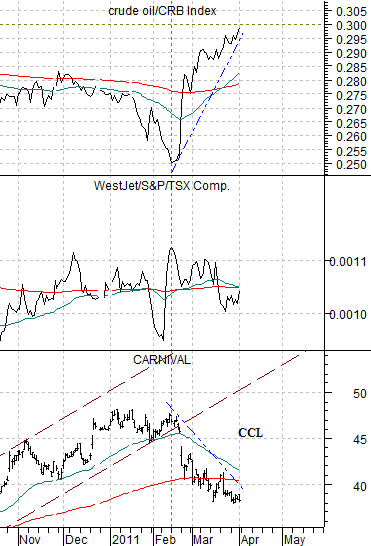
Below is a comparison between Carnival (CCL), the ratio between Canadian airline WestJet (WJA on Toronto) and the Cdn stock market (S&P/TSX Composite Index), and the crude oil/CRB Index ratio.
With crude oil prices still rising versus the CRB Index the pressures have not been lifted on the energy ‘users’. While GM had a nice bounce last Friday and there was a marginal rise in the WJA/TSX ratio we have yet to see the kind of price reaction from Carnival that would lead us to conclude that the markets are ready and willing to shift away from the ‘strong energy price’ theme.