The problem with being a contrarian is that it only works at the turns. Through a trend or a cycle it makes perfect sense to be trading in the same direction as the thundering herd even if you absolutely know that when your neighbor or in-law starts telling you about how much money is being made in the latest fad things are going to end badly. We suppose that the biggest lesson that we have yet to learn over the decades is that trends run far longer than you think likely or even possible and that the ‘far longer’ time period is full of missed profits and sleepless nights.
Aside from all of this… it is also true that trends change when it is least expected. If we have a problem with those who argue that it is all in ‘the fundamentals’ it would be that in between the time when the markets change trends and the fundamentals finally confirm what is happening… a significant chunk of the move has already been made.
In recent weeks we have noticed two things within the markets that have piqued our interest. These shifts may fade away as we move towards the cyclically strong May/June time frame but the reality is that long-term yields have started to fade lower and… price strength is starting to show up in the pharma sector.
April 15 (Bloomberg) — Pfizer Inc. and rival U.S. drugmakers are poised to report the industry’s biggest drop in quarterly profit in more than four years as the companies cope with record patent losses in 2011.
Almost everyone involved with the markets knows that the drug makers are facing a severe head wind as major revenue-producing drugs come off of patent between 2011 and 2015. Yet… we wonder.
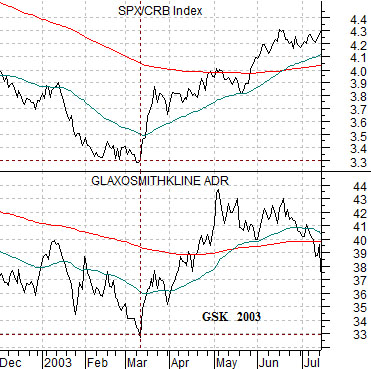
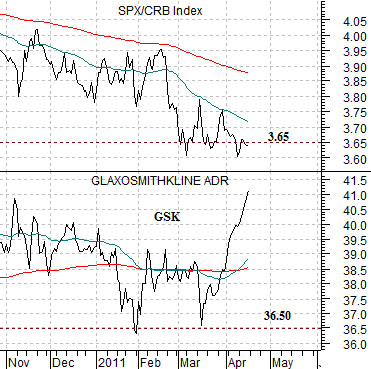
Below is a chart of GlaxoSmithKline (GSK) and the ratio between the S&P 500 Index (SPX) and CRB Index from 2003. We have argued that over time the price of GSK is often very close to 10 times the SPX/CRB Index ratio and that both tend to trend in the same direction. In 2003 as GSK bottomed at 33 the ratio was 3.3:1.
Next we show the same comparison for the current time period. Notice that as recently as last month the price of GSK was around 36.50 while the ratio was roughly 3.65:1. Since that point in time GSK has pivoted rather impressively to the upside even as the majority of investors fixate over the day-to-day action in energy, metals, and grains prices. Is the pharma train leaving the station? Based on earnings momentum and fundamentals it makes so little sense that we suspect that it actually may prove to be the case.
Equity/Bond Markets
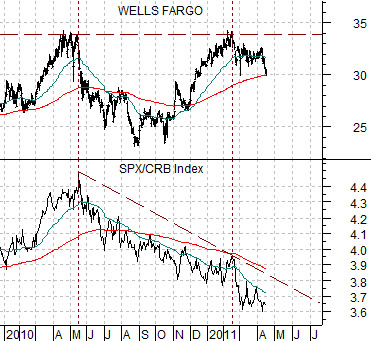
Above we showed that strength for GSK may indicate that we are approaching a time period when equities start to rise relative to commodity prices. Below is a comparison between Wells Fargo (WFC) and the SPX/CRB Index ratio.
The quick point is that a case can be made that a rising ratio could be positive for the financial stocks. A ratio closer to or above 4:1 may be enough to swing WFC up through resistance at 34.
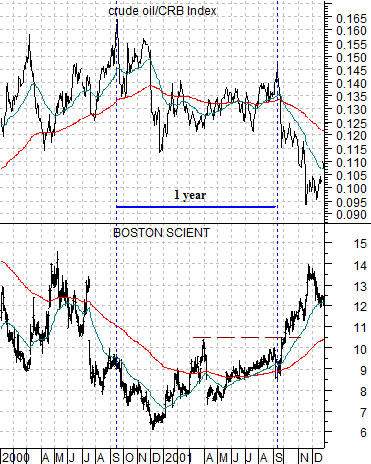
Below is a chart of Boston Scientific (BSX) and the ratio between crude oil and the CRB Index from 2000- 2001.
The idea here is that the peak for the crude oil/CRB Index ratio in September of 2000 was followed by a second top one year later in September of 2001 and that in between the two peaks the share price of BSX bottomed and started to trend upwards. BSX held near its moving average lines into the second of the top relative strength highs for crude oil and then jumped to the upside as energy prices began to weaken in the autumn of 2001.
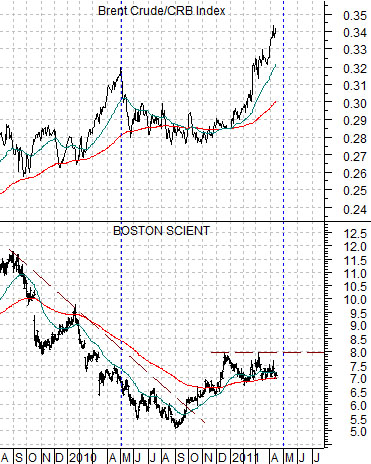
With a bit of imaginative flair we present below right the chart of BSX and the ratio between Brent crude oil futures and the CRB Index for the current time frame.
We have substituted Brent for WTI crude oil prices because… Brent has been leading to the upside.
The obvious difference is that the Brent/CRB Index ratio is at new highs but there are still certain similarities to 2000- 2001. The first relative strength peak for energy prices was reached at the end of April in 2010 so we are a couple of weeks in front of the one-year anniversary. As well the share price of BSX has made a bottom only to settle back on the moving average lines as energy prices soar higher.
The point is that if we start to see weakness in the energy price trend and BSX jumps to new highs above 8.00 then the set up will be somewhat similar to the final quarter of 2001. This will, in turn, suggest that the energy-centric trend has run its course for the next few quarters or even years.