If you don’t know the answer to the question… at times it helps to at least know what the question is. That was our thought today as we started to set out yet another IMRA issue.
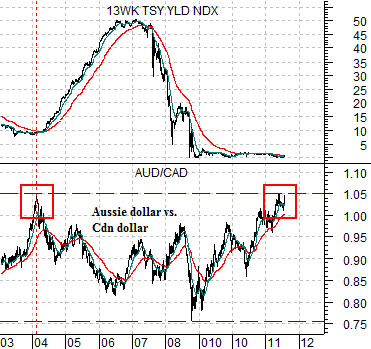
First is a chart comparison between the cross rate of the Australian dollar (AUD) futures and Canadian dollar (CAD) futures along with U.S. 3-month TBill yields from 2003 to the current time frame.
The AUD/CAD represents a number of themes. The Aussie dollar tends to be more closely associated with Asian growth while the Cdn dollar is tied to North American health. Both trade up and down with commodity prices but the AUD is more sensitive to the trend for copper. Key trend changes for this cross rate also tend to be associated with key trend changes for the direction of interest rates.
The AUD/CAD hit a peak around 1.05 back in 2004 just ahead of the start of rising short-term interest rates. An argument could be made that the recent run back up to the 1.05 level returned the relative value of the Aussie currency to the Cdn currency to the same levels that preceded the start of an upward trend for yields more than seven years ago.
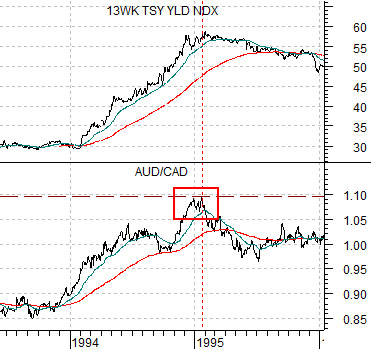
Below we have included the same comparison from 1993 into the very start of 1996.
The AUD/CAD has moved above 1.05 on only one occasion over the past few decades. The chart shows that the cross rate rose to 1.10 around the end of 1994.
The end of 1994 was auspicious for a number of reasons. First, it marked the high point for short-term yields and the end of one of the worst bond bear markets in decades. Second, it ushered in the start of an equity bull market that pushed prices higher through into 2000.
The point is that on two prior occasions a cycle peak for the AUD/CAD cross rate has marked an extraordinarily pivot point for the direction of yields. In 2004 it went with the start of rising yields while back in 1994- 95 it ushered in a trend towards falling yields.
If we do not know the answer we at least have a grasp on what the question might be. Are interest rates ready to move higher or lower? One answer, we suppose, would be ‘yes’.
Equity/Bond Markets
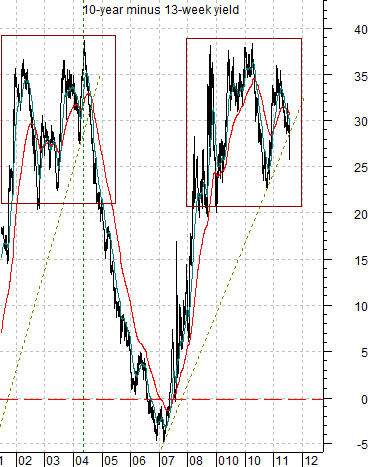
Let’s attempt to put this into some form of perspective through the inclusion of a chart of the spread between 10-year and 3-month Treasury yields.
In due course the yield curve is going to flatten. We suspect that the spread between 10-year yields and 3-month yields can not remain above 2.5%… forever.
The problem is that the yield curve can flatten in one of two ways. In 2004 the yield spread started to decline as short-term yields began to rise. This is the preferred route because it pushes us away from the sinkhole of deflation and suggests that we have a year or three worth of respite from impending economic doom.
The alternative to rising short-term yields is… falling long-term yields. Similar to the U.S. Japan has 0% short-term yields and 10-year yields of just over 1% (1.02% last seen). If the economic recovery fails it is almost certain that U.S. 10-year yields are going sub-2%.
So… the argument is that a cycle peak for the AUD/CAD marks a key trend change point for yields. The two alternatives are that U.S. short-term yields are set to rise or long-term yields are ready to decline.
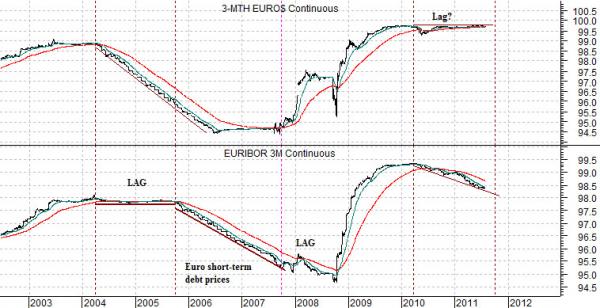
Below is a comparison between 3-month eurodollar futures and 3-month euribor futures. We are looking at short-term U.S. debt prices and short-term Eurozone debt prices.
In the good old days short-term debt prices rose and fell in tandem. In recent years, however, the ECB’s urge for independence has led to fairly major divergences. Between 2004 and 2005 U.S. yields rose while European yields remained flat. In 2007 U.S. yields began to decline while European yields remained high. Since the start of 2010 European yields have been rising while U.S. yields have remained at the lows.
The point? A major trend change could involve upward pressure on U.S. short-term yields or downward pressure on European yields.