Our premise today is based on an argument that we made on a couple of occasions over the past few weeks. Following the asset price collapse in Japan in 1990 the markets shifted into a decade-long trend that included falling Japanese interest rates relative to U.S. interest rates. From 1990 up to the Nasdaq’s peak in 2000 Japanese 10-year bond prices rose relative to U.S. 10-year bond prices.
With the final top for the Nasdaq in 2000 the trend shifted. Instead of Japanese interest rates falling the macro trend focused on squeezing U.S. yields down towards Japanese yields. Almost a decade later the Fed has joined the Bank of Japan with a near-zero percent interest rates policy but the problem is that the markets- which control longer-term Treasury yields- keep pushing U.S. yields higher in response to commodity and Asian-related strength.
The end result over the past few years has been long periods of rising U.S. yields followed by rather intense periods of crisis that pull yields lower. Our argument is that there is a massive underlying trend that is pulling 10-year Treasury yields lower while a series of shorter-term trends keep pushing them higher.
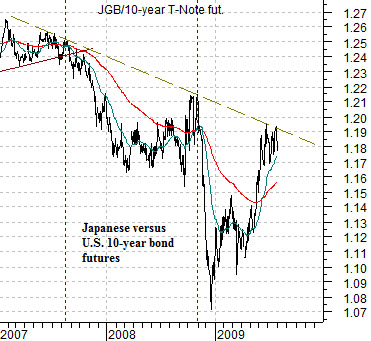
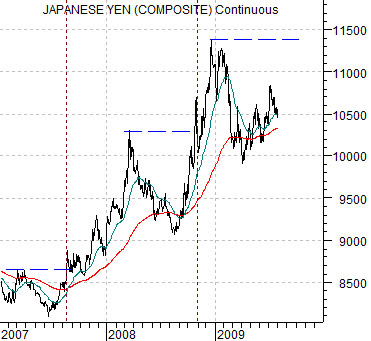
At top right we show the ratio between Japanese and U.S. 10-year bond futures. Below right we have included a chart of the Japanese yen futures.
Our thesis is that the JGB/T-Note ratio is ultimately going to resolve down towards around 1.05:1. For this to happen U.S. bond prices have to rise by a fairly substantial amount or… Japanese bond prices have to decline by an equally substantial amount.
The point that we are attempting to make is that currently we are ‘between crises’. As long as the JGB/T-Note ratio is not falling the markets go about their business as if nothing much is amiss. So… is there any one market or indicator that might warn us of an impending problem? Our thought is that it is ‘new highs’ for the Japanese yen futures. When the yen futures broke to new recovery highs in 2007 above roughly .8700 it marked the start of downward pressures on the financials. When the yen broke to new highs in September of last year it initiated a second wave lower in the JGB/bond ratio as the financials once again began to implode. The closer the yen gets to the highs set last December between 113 and 115 the greater the risk for asset prices.
Equity/Bond Markets
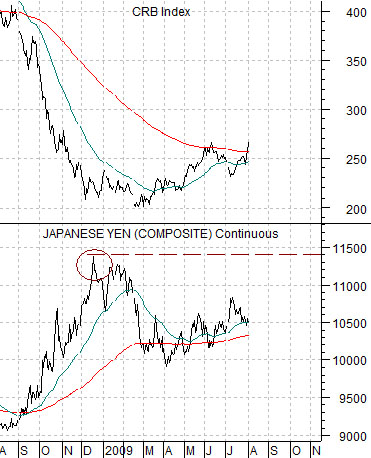
Carrying on with today’s first page argument we show the Japanese yen futures (JPY) and the CRB Index at top right.
In December of last year the Japanese yen AND the long end of the U.S. Treasury market topped out in price to signal the peak for the crisis. The chart shows that as the yen trended back to the down side the markets gradually began to unclench leading to a broad recovery in commodity prices.
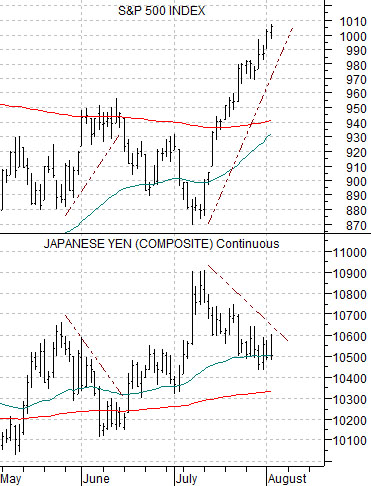
To put this into equity markets perspective we show a chart of the Japanese yen futures and the S&P 500 Index below right.
On page 1 we argued that new recovery highs for the yen would likely go with yet another period of crisis. At top right we showed that once the yen began to weaken last December the markets moved towards a broad recovery.
What we would now like to show is how tight the relationship actually is. The chart makes the case that this isn’t some sort of broad macro theme that may or may not jump out and bite the markets in the back side one of these days. In fact this is a day-to-day trading relationship because each time the yen shows any kind of strength the S&P 500 Index turns lower and once the yen begins to decline the equity markets swing higher. If there is a worrisome detail to this it would be that the yen keeps making ‘higher highs’ which suggests that eventually it is going to retest last year’s upper extremes.
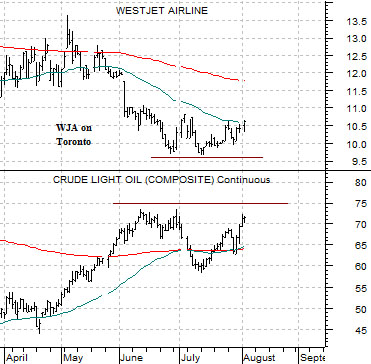
Quickly… in trading yesterday crude oil prices were fairly flat, the Amex Oil Index was down a very small percentage, and the Airline Index (XAL) was up close to 5%. This is a ‘second half of the year’ phenomenon that suggests that the markets may actually be starting to trade in a manner suggestive of a cycle high for energy prices.
To explain we have included a chart of Canada’s WestJet (WJA) and crude oil futures below. If WJA continues to rise then it argues that crude oil prices made some sort of cycle top at the end of the second quarter.