Let’s start out by explaining the thesis.
Our view is that economic cycles are dominated by either consumer spending or capital spending and that recessions mark end of one theme and the start of another. The peak for a capital spending theme will be followed by a recession and will lead into a consumer spending theme.
If the dominant theme in Asia (i.e. China et al.) is capital spending the theme in the U.S. will be consumer spending. And vice versa.
The Nasdaq’s bubble top in 2000 marked the peak for a developed markets capital spending cycle which was then followed by a consumer spending theme fuelled by mortgage refinancing and- eventually- rising real estate prices.
In theory the consumer spending cycle peaked between 2007 and 2008 as housing prices began to tumble. This should have gone with the end of the capital spending theme in Asia. Our thought is that in trying to save the banking system from what appeared to be certain disaster the U.S. focused stimulus into the consumer sector while China responded by accelerating construction growth.
The bottom line is that instead of a clear trend change following the 2008 debacle the markets returned to the old trend. In our more negative moments we worry that this means that we may have to wade through a second recession. Time will tell.
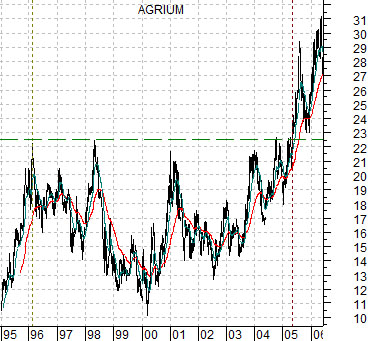
Below is a chart of Agrium (AGU) from 1995 into 2006. The quick point is that AGU spent close to a decade making a bottom below the 22 level (prices are in Cdn dollars) before the stock finally broke to new highs in 2005. At the peak for commodity prices in 2008 AGU’s share price approached 115.
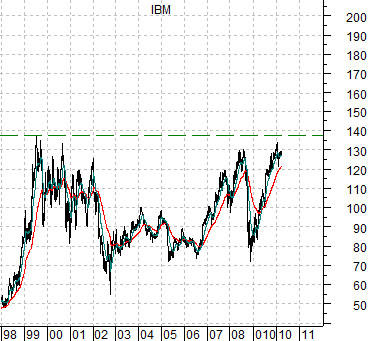
Below is a chart of IBM. For good or for bad we tend to equate IBM with the capital or business spending theme.
In terms of our thesis the theme should be in the process of shifting over to a trend that will favor capital spending and one the ways that this might show up through the early stages would be via new highs for IBM. While Agrium broke out of its trading range more than year before grains prices began to strengthen during the previous decade a move above 140 by IBM could be an early warning indicator that the focus of growth in the U.S. will be based on business spending while the future of China’s growth will come from an improvement in consumer spending.
Our next thesis revolves around our antipathy towards gold. In the short to intermediate term we can certainly see gold prices rising back to the old highs or even pushing on towards 1400 but if, as, or when the Swiss franc falls below .9200 we are going to be very interested in being negative on gold prices.
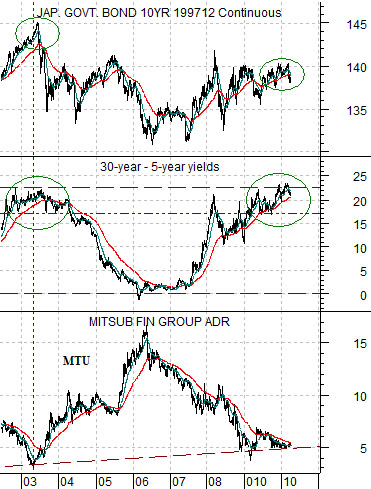
Below we compare the share price of Japanese bank Mitsubishi UFJ (MTU) with the spread between U.S. 30-year and 5-year Treasury yields (one version of the yield curve), and 10-year Japanese (JGB) bond futures.
The share price of MTU is supposed to be at a bottom when two things happen. First, the yield curve is at its most steep. Second, the Japanese bond market is at a peak.
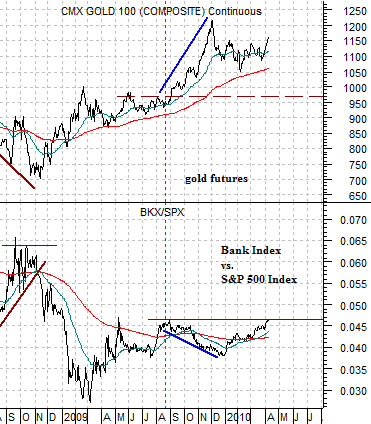
We are going to come back around to our point from another angle so we will push on to the chart below. The chart compares gold futures with the ratio between the Bank Index (BKX) and the S&P 500 Index (SPX).
We have argued that there were three main ‘drivers’ behind rising gold prices- the weak dollar, very low short-term interest rates, and weakness in the bank shares. The view has been that the higher the BKX/SPX ratio rises the greater the downward pressure on gold prices.
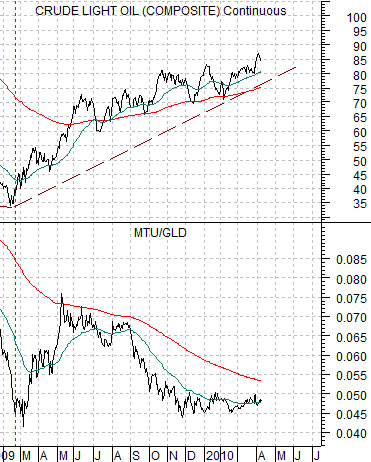
Further below is a chart of crude oil along with the ratio between MTU and the gold etf (GLD).
If MTU is at a bottom when the Japanese bond market is at a top then weakness in Japanese bonds supports a better trend for the financials. If the financials are the flip side to gold prices then, in a sense, the conditions that support a rising trend for MTU also have the potential to push gold prices lower.
