In general… in recent years the markets have tended to focus on energy price strength through the first two quarters.
In general… when grains prices have been stronger the tendency is for prices to peak around the end of the second quarter.
Quite often… we have read in recent weeks that global consumer spending is being pinched by rising energy and food prices.
Unless the markets do something wholly unexpected the argument would be that as we shift into the second half of this year the pressures from energy and grains prices should abate leading to a gradual improvement in consumer confidence and spending.
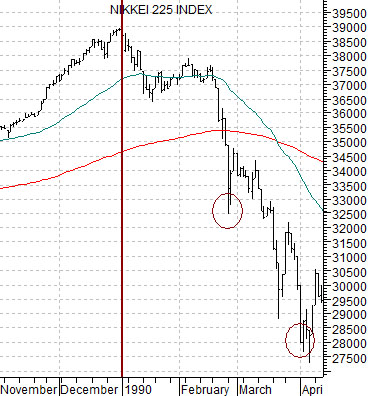
However… that isn’t today’s point. Given that we have some time to burn between now and month/quarter end we thought that we would attempt to build a case for a bit of mid-month drama. The argument is based on the two examples shown below.
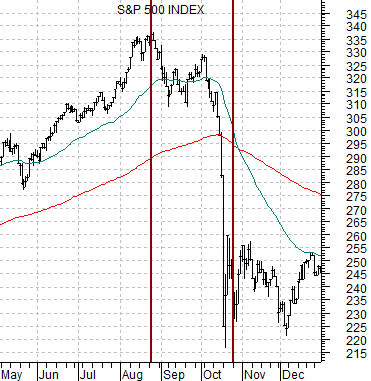
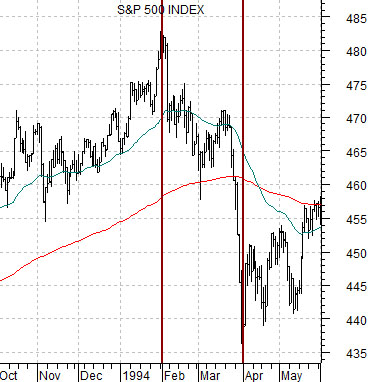
We have included a chart of the S&P 500 Index from 1987 as well as a chart of the SPX from 1994. The idea is that ‘crashes’ are in large part a function of a market going from top to bottom over a two month time period. The ‘crash’ itself is essentially a compressed decline following a few weeks of price strength in the middle of the two-month correction.
The SPX peaked in late August of 1987 and bottomed in late October. The majority of the collapse was telescoped into the middle of October following an ‘up and out’ rally through much of September.
We have long been fascinated by the 1994 example because… it has an identical structure to 1987 on a much smaller scale.
In 1994 the SPX peaked at the start of February and bottomed two months later at the start of April.
The idea here is that ‘crashes’ tend to swing around the end of a quarter. In 1987 the decline did not begin until the beginning of the fourth quarter while in 1994 the decline was completed into the end of the first quarter. In both instances the entire process- from top to bottom- lasted for almost exactly two months. With this in mind we will push on to why this may be relevant this month.
Equity/Bond Markets
May 21, 2011: LONDON—The world oil market urgently needs extra supplies to prevent economic damage to importing countries that could derail the global recovery, the governing board of the International Energy Agency said… The IEA said it wants to work in a constructive spirit with oil producers, but added that it is, “prepared to consider using all tools that are at the disposal of IEA member countries.”
The IEA’s most powerful tool is the ability to coordinate the release of publicly held oil stocks onto the market.
June 8 (Bloomberg) — OPEC failed to reach an agreement on crude production for the first time in at least 20 years, after six countries opposed a Saudi Arabia-led group that urged members to raise output as oil trades above $100 a barrel.
So… how might we get from here to there?
The basic argument is that a trend continues until something changes. A dramatic reversal of a trend usually requires some sort of ‘surprising’ development that catches money leaning in the wrong direction.
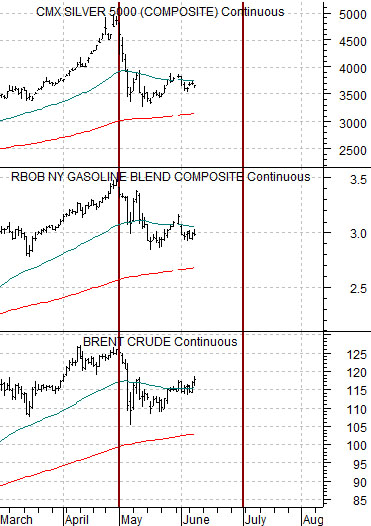
To set the stage we have included a chart of silver futures, gasoline futures, and Brent crude futures below.
The idea here is that all three markets are trending in the same direction. West Texas Intermediate is the tail being wagged, in a sense, by the Brent crude oil dog. The trend is not going to reverse until Brent stops rising and, we will argue, there is an apparent link between Brent, gasoline, and silver prices with another connection between silver and gold.
Above we mused about the potential for a ‘crash’ to reach at least the first bottom about two months after the peak. While this may be nothing more than an extrapolation from an extremely small sample size the argument is that it is possible to reach bottom in two months and… in most cases ‘crashes’ revolve around quarter ends.
Once again… how might we get from here to there? The markets ‘set’ a top for silver, gasoline, and Brent crude at the end of April more than a month ahead of this week’s OPEC meeting. Energy and metals prices declined sharply during the first half of May before shifting into a more positive trend.
Our thought is that the charts have the look of a market struggling with a decision. Prices are either going to drive on to new highs or… we are in the midst of some kind of change of trend. The way things have set up it ‘feels’ (a handy word for a fanciful thought) as the if late April peak is in some way related to the end of this quarter. It is entirely possible- and perhaps more than likely- that prices simply grind higher through until month end. But… what if?
What if OPEC fails to increase crude production and prices start to rise. What if the IEA responds- as threatened- by organizing a dump of inventories onto the market? While hardly a long-odds scenario our sense is that this is exactly how we might get from here to there over the next number of weeks.