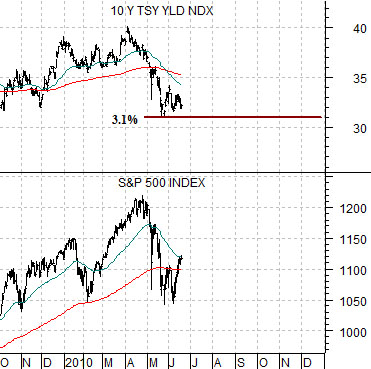
We start things off today with a comparison between the current situation and the cycle top through 2000. While we argued last week that the big difference between now and 2000 might be the slope of the yield curve (it was inverted in 2000 and is ‘wide open’ today) the tendency for cyclical asset prices to peak during the first year of a new decade makes the comparison somewhat relevant.
Below is a chart comparison of 10-year Treasury yields (TNX) and the S&P 500 Index (SPX) from October of 1999 through 2000. Below right we feature the same comparison starting in October of 2009.
The basic argument is that there are two forces working on the markets. One is pushing interest rates higher as global growth recovers following the markets melt down in 2008. The other is pulling yields lower as the extended deflationary trend arbitrages U.S. long-term yields down towards those of Japan.
If the recovery wins out then Japanese 10-year yields- currently 1.2%- will move up towards U.S. 10-year yields (3.22%). This is the bullish outcome for asset prices. If deflation proves to be the stronger then U.S. yields will resolve down towards or, perhaps, through 2%.
Either case fits with the ‘decade theme’. In the first instance the market that has reached a peak at the start of the new decade would likely be the Japanese bond market while the latter outcome would likely point to a period of protracted weakness for commodity prices.
In any event… in 2000 10-year Treasury yields rose to a peak months ahead of the S&P 500 Index. Yields broke below the 200-day e.m.a. line and then held the lows until the end of August. At that time yields began a series of tests of the support line around 5.7% as the SPX turned lower.
Our thought is that the decline in yields down to around 3.1% in April and May could represent the end of the global recovery. Our bullish stance is based on the idea that if yields can simply hold above 3.1% for a few months or quarters then the SPX can make one or more rallies back towards this year’s highs. If 10-year yields break 3.1% then we would expect the trend to continue over time down to 2.0% but if the May lows act as support then the odds appear to be stacked in favor of stronger equity markets prices.


Equity/Bond Markets
Below is a comparison between the S&P 500 Index and 2-year U.S. Treasury futures.
Through 2006 and into 2007 2-year T-Note futures traded in a reasonably flat range. Once prices began to rise in mid-2007 the trend for equities began to weaken somewhat. Following the break above resistance by 2-year T-Note futures in the second half of 2007 the trend for equities turned negative even as the SPX held near the highs through into the end of the year.
On page 1 we mentioned two forces. The first is pushing asset prices and yields higher while the second is pulling asset prices and yields lower. IF the latter wins out then the market will slowly squeeze longer-term yields down towards 0% as 2-year T-Note futures rise above the peak levels set at the end of 2008.
The chart comparison suggests that new highs for the 2-year T-Notes would be similar to the strength witnessed during the back half of 2007 as the equity markets resolved lower. On the other hand as long as the 2-year T-Notes are NOT making new highs above 110 then the underlying trend for the SPX would continue to be positive.
June 21 (Bloomberg) — China’s signal of an end to the yuan’s fixed rate to the dollar may accelerate a shift toward domestic demand as the prime driver of growth as President Hu Jintao seeks to strengthen household incomes.
June 20 (Bloomberg) — Dubai’s benchmark stock index rose the most in 10 weeks and Egyptian shares gained, leading a rally in Middle East markets on growing confidence that Europe will contain its debt crisis. Oil gains boosted Gulf shares.
We do not know whether China’s shift towards greater exchange rate flexibility will help to ease some of the stresses within the markets but we admit to be encouraged by the reaction over the weekend by the Middle Eastern equity markets. Kuwait and Egypt, for example, were slowly approaching the lows of March of 2009 so any kind of sustained strength will be helpful.
Further below is a comparison between Coca Cola (KO) and an annual percentage Rate of Change (ROC) indicator for the U.S. Dollar Index (DXY) futures.
The dollar turned higher in late November last year and continued to strengthen for almost exactly six months into late May.
The share price of KO has tended since 2006 to trend inversely to the annual percentage change for the dollar so the tepid rally from late May into the current month reflects the cooling off of the dollar’s ascent.
Given that markets often trend in one direction for a series of quarters and given that KO was in a down trend for six months in the face of dollar strength the thought is that the news of a more flexible yuan might end up weakening the dollar somewhat. In a sense if KO were to push out of its downward sloping channel by moving above 53.50- 54 then something material- and apparently equity markets bullish- would have changed within the markets.


