Every few years we bring up the argument for contrary investing. The last time we did so was at the end of 2008. We asked a number of brokers what the one trade was that their clients simply would not agree to and were told that it was buying equities. In December of 2008 even agreeable long-standing clients refused to go long just about any stock. Before that we used this argument in July of 2007 after being told that the one trade that clients would reject was selling any of their bank stocks. We could go on but… perhaps our point is made. The banks started to slide in the middle of 2007 and the equity markets turned higher in early 2009.
Given that the hardest trade at the moment would be to go long Japan we thought we would present two intermarket arguments in favor of doing exactly that. Here goes.
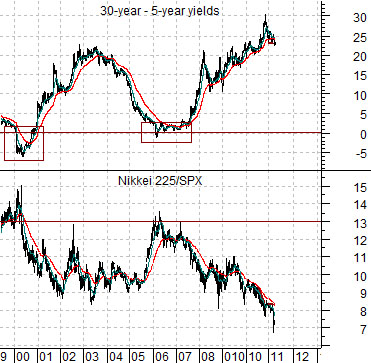
Below is a comparison of the yield spread between 30-year and 5-year U.S. Treasury yields (one depiction of the slope of the yield curve) and the ratio between the Nikkei 225 Index from Japan and the S&P 500 Index.
When the yield spread is high… the Nikkei is low. And vice versa. In fact the last two times the yield spread declined to or below ‘0’ the Nikkei/SPX ratio was above 13 times. Today it is closer to 7 times. Based solely on the fact that the yield spread is near its peak- a point in time when one would expect the Nikkei to be low relative to the SPX- and the observation the spread seems to hit bottom every 6 or 7 years… it makes sense to be long the Nikkei until the Fed has raised the funds rate all the way to the next cycle top. That, we suspect, will take a year or three.
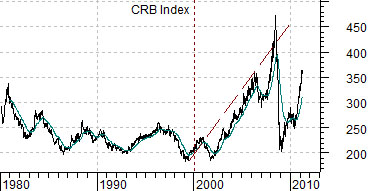
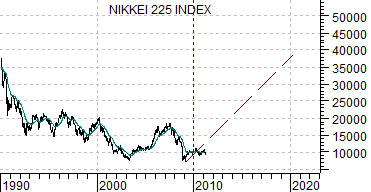
Below is a comparison between the commodity markets (CRB Index) and the Nikkei 225 Index. The charts have been offset by exactly ten years.
The commodity markets peaked in 1980 and suffered through a 20+ year price consolidation that ended some time between 1999 and late 2001.
The Japanese stock market reached a top ten years later in 1990 and after a 20+ year price decline made an initial bottom in 2009. The argument against being long Japan based on this chart is that the CRB Index made a ‘double bottom’ into late 2001 but our counter to this is that the actual bull market started in 1999 followed by a sharp upward swing to regain the rising trend in 2002. In other words… the Nikkei might well go lower but if history were to repeat… when it swings back to the upside it will do so with tremendous vigor.
Equity/Bond Markets
New York Times, Sept. 22, 2001: WASHINGTON— With politicians around the world seeking answers to surging oil prices, Vice President Al Gore placed the issue squarely into the U.S. presidential campaign Thursday by urging President Bill Clinton to draw on the government-held emergency petroleum reserve to bring prices down.
Against a backdrop of oil-related turmoil in Europe and fears that petroleum prices could bring a return to high inflation and lower economic growth rates, Mr. Gore sought to ease the concerns of U.S. homeowners and manufacturers of a difficult winter ahead.
The more things change… the more they apparently remain the same.
The year 2000 was not that long ago but we suspect that very few actually recall that the U.S. and Europe were in the midst of an energy price crisis that year. In fact the rise in heating oil and gasoline prices through the second half of 2000 was so unsettling that the Clinton administration began to talk publicly about releasing crude oil from the Strategic Petroleum Reserve.
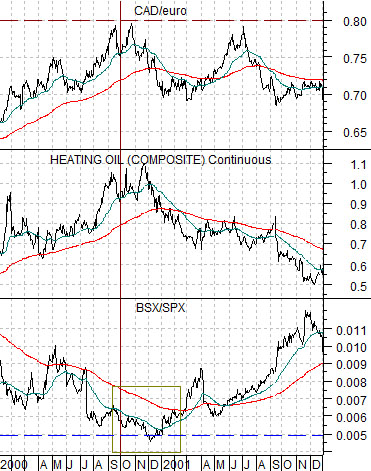
Next up is a chart comparison between the cross rate between the Canadian dollar and the euro (CAD/euro), heating oil futures, and the ratio between Boston Scientific (BSX) and the S&P 500 Index (SPX) from 2000- 2001.
In late 2000 as heating oil futures rose to a peak the CAD/euro was pushing up towards .80 while the ratio between BSX and the SPX had fallen to a cycle low just be low .005.
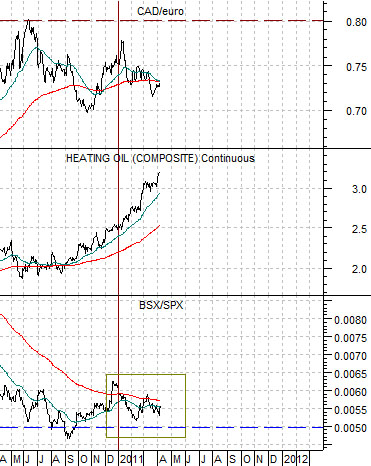
Now… let’s compare these three markets with the current situation. We have included the same chart for the present time frame below.
We are once again ensconced in a rising energy price trend and, similar to 2000, it is derived from upward pressures emanating from Europe. In 2000 there was a shortage of refined products as transit works blockaded refineries while in 2011… there may or may not be a shortage of easily refinable crude oil due to issues related to Libya.
September 23, 2000: Washington — One day after Vice President Al Gore called for tapping the Strategic Petroleum Reserve to reduce oil prices, President Clinton moved to release 30 million barrels of crude oil from the 570-million-barrel stockpile.
Energy Secretary Bill Richardson announced the decision, marking the first time since the Persian Gulf War in 1991 that the reserve is to be tapped — and the first time ever for nonmilitary purposes since the stockpile was created more than a quarter-century ago.
As an aside, Democratic presidential candidate Sen. Hillary Clinton called on the Bush administration in late 2007 to release oil from the reserve to contain rising energy prices. With the benefit of hindsight we can see that this action in 2000 helped break the back of the energy price cycle while a similar response in 2007 might have gone some way towards busting the rising trend that took crude oil to almost 150 into mid-2008.
Our point, by the way, is that the cross rate between the Cdn dollar and euro and the ratio between BSX and the SPX are at similar levels to the end of 2000.
March 11, 2011 (Bloomberg) — President Barack Obama said he’s prepared to tap the nation’s strategic oil reserve if necessary to deal with any disruptions in the energy supply and said the Justice Department will be on the watch for any evidence of price gouging.