We are going to show what we believe is a long-term positive view on the Japanese stock market but to get from here to there we first have to establish a premise or two.
Many have noticed over the past few years that the trend for the broad cyclical trend that has been pushing both commodities and equities higher and lower is similar to that of the cross rate between the euro and yen. The euro/yen cross is often described as a barometer for investor’s willingness to push towards risk so when the euro is stronger stock prices tend to rise and when the yen is stronger stock prices are often declining. Fair enough.
Our argument is that this makes perfect sense as long as the underlying trend has not changed. In the context of the trend that has dominated since the Nasdaq peaked in 2000 a stronger euro is bullish while a stronger yen is bearish. To make a case that a stronger yen will eventually prove to be a positive we have to show that yen strength is something more than a flight away from risk.
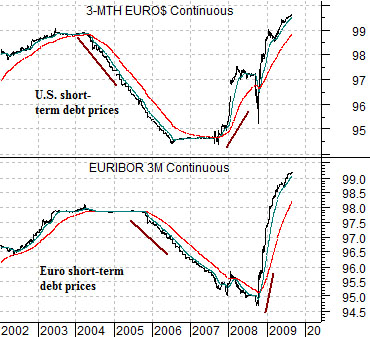
Below is a comparison between 3-month eurodollar futures and 3-month euribor futures. The first rather quick point is that for much of the past decade the European Central Bank has lagged behind the Fed with U.S. yields rising in 2004 (i.e. falling eurodollar prices) while euro-denominated yields did not turn higher until late 2005. U.S. yields began to decline in the second half of 2007 while European yields held near the highs until the autumn of 2008. The point is that one can make a case for a weaker euro- especially against the dollar- simply by observing the tendency for U.S. yields to rise and fall well ahead of European yields.
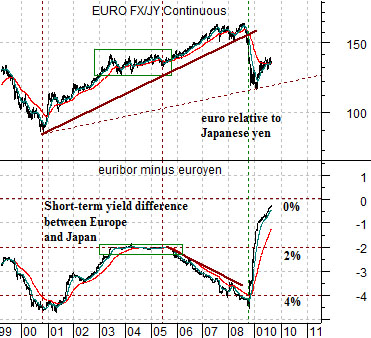
Just below we show the euro/yen cross rate and the spread between 3-month European (euribor) and Japanese (euroyen) short-term debt futures prices.
Why has the euro been rising against the yen since 2000? Because from 2000 into late 2008 European short-term yields were consistently 2% to 4% higher than Japanese yields. The difference between today and any time since in the last decade is that the spread has fallen from more than 4% last year to almost zero this year. As long as Euro-zone yields are higher than Japanese yields one can argue that yen strength is a cyclical negative but the world turns upside down if, as, or when Japanese yields actually rise above European yields. If that were to happen then a stronger yen would represent ‘growth’ while euro strength would reflect risk aversion.
Equity/Bond Markets
Let’s take another brief run at the points that we are attempting to make today. The euro has been stronger than the yen for the past decade and this makes sense given that European interest rates have been significantly higher than Japanese interest rates. Japanese investors can stretch for yield by buying European bonds and risk-based accounts have been able to borrow in yen at close to 0% to invest elsewhere.
If the base trend does not change then yen strength will be a negative. If, on the other hand, Japan recovers ahead of Europe- possibly due to its exposure to China- then it is conceivable that Japanese short-term yields will actually rise through European yields. If that were to happen then yen strength would be a positive.
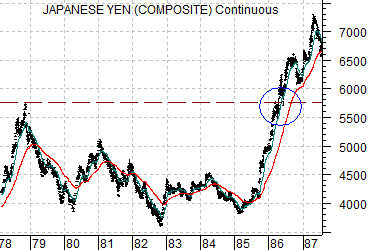
Finally… we move on to today’s point. Below we show a chart of the Japanese yen futures from 1978 into 1987.
The argument is that the yen held below the 1978 peak all the way through into early 1986. Commodity prices collapsed in 1981 leading to a double-dip recession and a long period of relative strength by the non-commodity sectors and by 1986 the yen pushed to new highs.
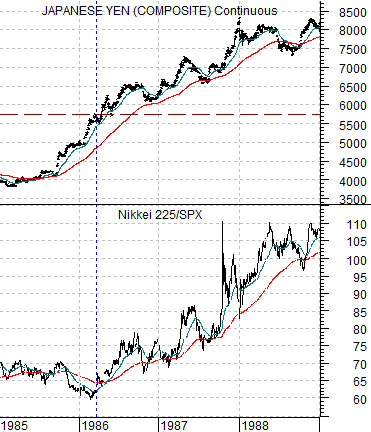
Below we show the Japanese yen futures (JPY) and the ratio between the Nikkei 225 Index and the S&P 500 Index from 1985 through 1988.
When the SPX bottomed in August of 1982 the Nikkei/SPX ratio was close to 65:1. In the spring of 1986 as the yen pushed to new highs the ratio was still close to 65:1. The point is that the Nikkei was no stronger but also no weaker than the SPX during the first few years following the peak for commodity prices. When the yen pushed to new highs, however, the Nikkei/SPX ratio swung powerfully higher suggesting that the start of the asset price bubble in Japan that peaked in 1990 was created by capital flows directed towards Japan.
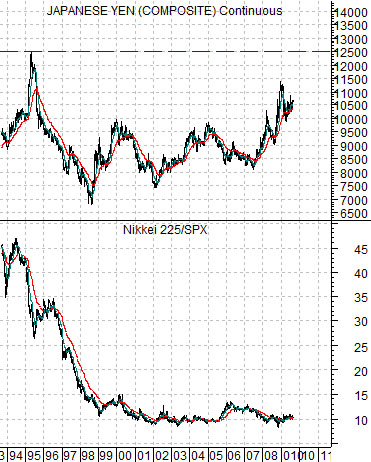
Below we show the same comparison for the time period beginning back in late 1993. The last major peak for the yen was reached in 1995. In theory- and this is our point- as long as the yen holds below 125 against the dollar the Nikkei/SPX ratio will remain relatively flat. The Japanese stock market will have good days and bad days but, on the whole, will do about as well as the S&P 500 Index. If, however, the yen were to push up to and then through 125 then the set up becomes somewhat similar to 1986 with yen strength reflecting the start of what may end up being a second Japanese asset price bubble later this decade.