

Today Actavis (ACT) issued $21 billion in bonds, the second biggest bond deal ever. Given low interest rates globally, it makes sense for companies to issue debt. However, according to research from Goldman Sachs (source:ZeroHedge), corporations have been the largest buyers of their own stock. For example, in 2014 Goldman estimates $415B of net inflows into equities from corporates.
It’s interesting to consider corporate stock buybacks in the context the Federal Reserve’s Z.1 Flow of Funds accounts. First, let’s just look at total debt levels from this quarterly report. There are three big debt categories, Households, Business, and Gov’t. In terms of total debt outstanding, these three are of similar size.
- Households at $13.4 Trillion
- Business at (record) $11.8 T
- Fed’l Gov’t at $12.8T. (State and Local gov’ts are at $2.9T).
In terms of growth rates over the past year, Household was only 2.7%, Business was 5.2% and Fed’l Gov’t 7.2%. The business category splits out Corporate Debt which was, as of Q3 2014, $7.438T (a record), up $382 billion year-over-year. So, by roughly comparing Goldman’s data of $415B in buybacks in 2014, with the annual growth Corporate Debt from Z.1, it appears as if corporations in aggregate are simply substituting debt for equity. Given low market rates and corporate profits near a record percent of GDP, the additional debt wouldn’t appear to inject any stress into the system. Yet …
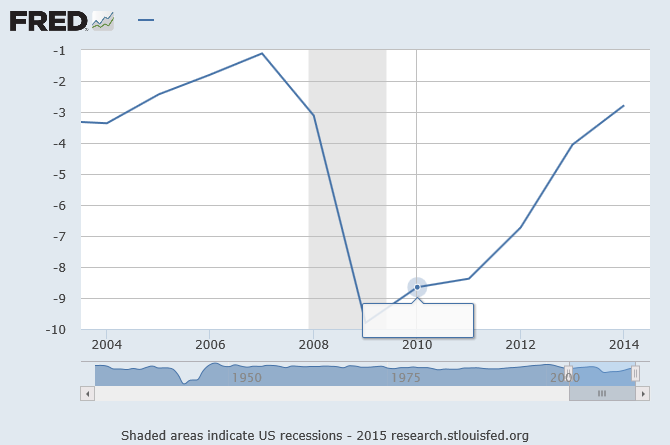
In terms of Federal Gov’t deficits, as a percentage of GDP, they have been consistently falling, from nearly 10% of GDP at the height of the recession in 2009 to just 3% now. Even without QE in the US, the supply of government debt is declining (smaller deficit means less need to borrow). And outside of the US, QE programs in Japan and the EU are sucking up the supply of high quality government securities.
FEDERAL SURPLUS OR DEFICIT AS PERCENT OF GROSS DOMESTIC PRODUCT
Now let’s consider these dynamics with respect to swap spreads. (Spread between the rate on the benchmark government note to the rate on the swap). One of the purposes of QE is to push down the yields on riskier securities in order to spur bank lending and investment, which we would hope would go into productive assets and capital equipment/structures rather than paper. What we see is that borrowing has indeed grown (Corp debt was $6.337T at the end of 2007and is now $7.438T), but investment in capital goods has lagged and stock buybacks have exploded.
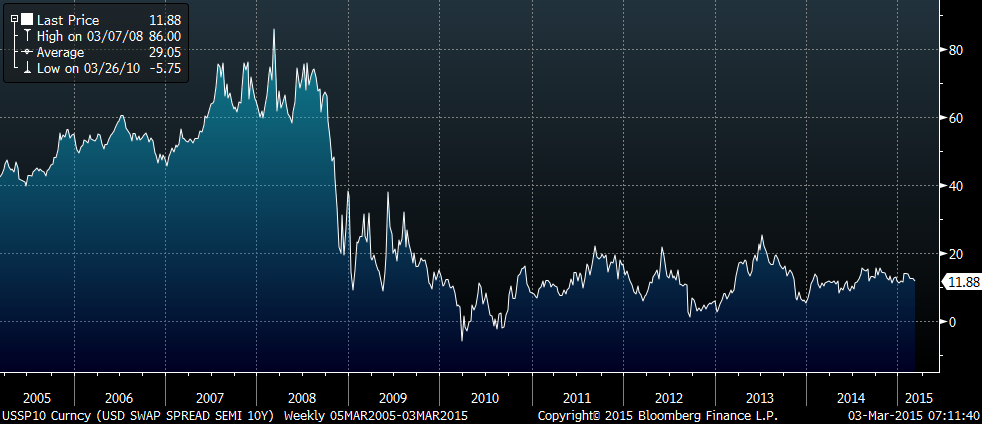
From the ten-year chart of the 10-yr swap spread, we see the current level at about 12 bps, around the midpoint of the past four year range of around zero to around 25. In 2005 to 2006, prior to the crisis, this spread was more like 40 to 60. As the crisis developed it shot up above 80 bps in 2008.
TEN YEAR CHART OF THE TEN-YR SWAP SPREAD
So, the situation we are now in is as follows: 1) The Fed is considering the timing of rate hikes, which all else being equal creates balance sheet risk, given relatively high levels of corporate debt. 2) The “float” of high quality government debt has become constrained due to QE programs and a lower Federal deficit. 3) The strength of the US dollar has created unfavorable currency translations for multi-nationals in the US thereby threatening profits. 4) There have been some high profile gains accruing to labor rather than capital, most notably Walmart announcing increased wages.
The conclusion is that various measures of risk, one of which is the swap spread, should begin to increase in price. In the futures markets a widening spread can be replicated by selling a strip of eurodollars vs buying treasury futures. It is sometimes called a “Term TED”. The point is that watching a spread like this can perhaps indicate increased stress relating to financial stability, and given the current backdrop, it appears to be at a low risk level to buy.
Note: The next Z.1 Flow of Funds report by the Fed comes out March 12, 2015. We’ll be watching relevant figures.
#####

