

If you take a trade, and it does not work the math is easy; you stop out. But what if you have a winning trade? What now? Here is where the mastery begins.
Even though there are a lot of different trailing styles and techniques, in reality, there is only one that is highly efficient and you get the most out of it. This one is based on support and resistance and a price pivot trail.
In the world of trading, no two trades move the same. In general, and theoretically, once a trade triggers, you need to watch its trading pattern and momentum, whether it is a day trade or a swing trade. Evaluate its progress. Is it accelerating to your target, getting extended, running in overbought or oversold areas? Is it taking its time and slowly grinding in your desired direction, or is it establishing a clear normal textbook evolution? In any case, you need to analyze the trading pattern, adapt, and then apply your trailing-stop magic skills.
Simply put, if you are willing to live through pullbacks, the method of trailing I find most rewarding is the pivot trail. At times, though, you get a power move that reaches all your targets, and when this happens, you need to adapt by applying the same method but zooming in on a smaller time frame that will offer you the same trailing method (so you do not deviate from your plan), and you would be able to bank profits before they turn around on you.
In the day trading and swing trading classes I teach, I show traders how to adapt their trading and trailing skills according to the market or stock environment. While the most known trailing methods are based on support and resistance, the essence is to know when to use one or the other or a combination, which is most effective.
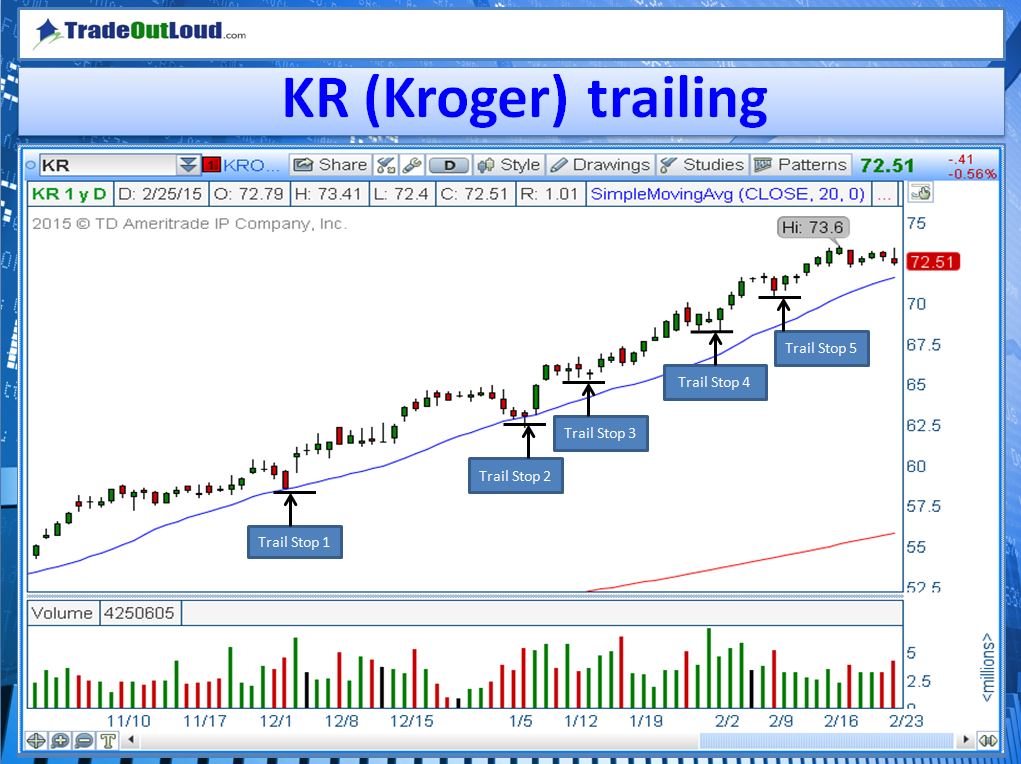
In the example below KR (Kroger), a power-swing trade, you can see how the easiest way to trail is by trailing based on support areas on the daily chart. Trailing stops will be placed below each swing low.
Another example is this week’s call made on March 2, 2015 from my Swing Trade Alerts Service.
The Stock
BA – The Boeing Company is an American multinational corporation that designs, manufactures, and sells airplanes, rotorcraft, rockets and satellites. It also provides leasing and product support services.
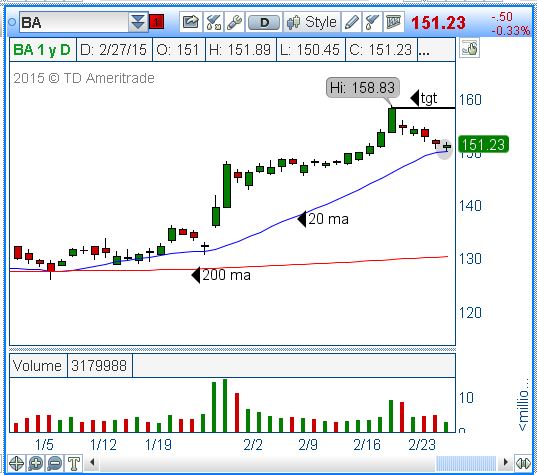
Technical Pattern
An upgrade and a downgrade only one day apart pushed the breaks to this extended run higher. The stock entered into a correction and currently is it pulling back into the 20 ma on the daily chart as you can see from the chart below. I will be looking for a buy in this area with a long bias and a swing target into $158.00 area.
The Trade
- BA long over $152.00
- Stop under $150.00
- Targets: $153.20, $154.00, $155.00, $156.00
- Void into $158.00
- Risk: $ 2.00
- Potential reward at ultimate target: $6.00
Technical Picture
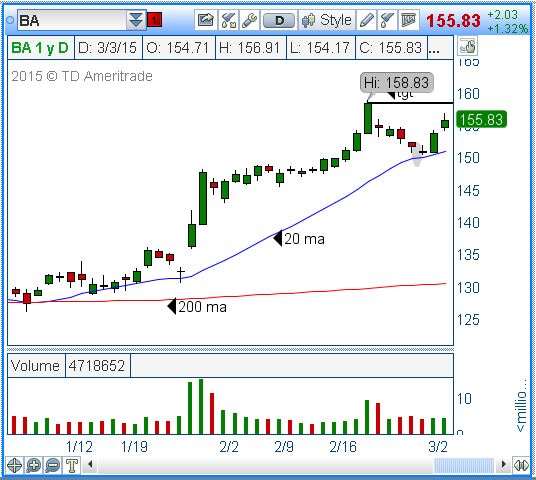
And take a look at the trade now. BA has reached 4 out of the 5 targets. See daily chart below.
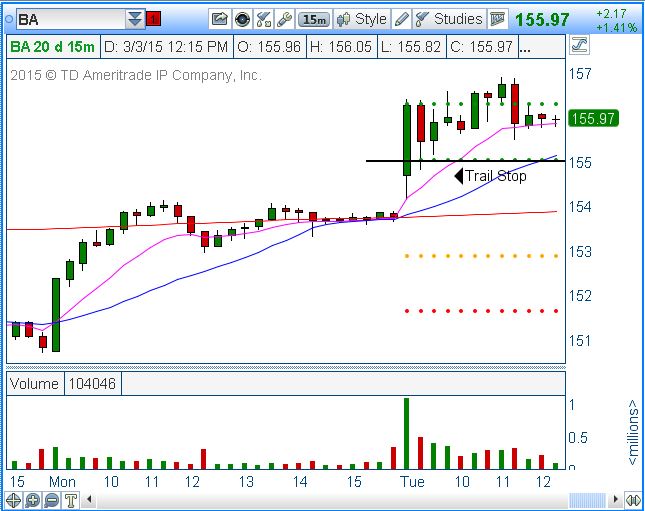
At this point we still have one lot left in the game, so our focus will be towards the 15-min chart. You might be asking why such a small time frame for a swing trade?
The answer is easy – although this is a swing trade this stock has powered hard through targets is time to think “lock in profits,” especially now that the market indices correcting and testing support areas. In the chart below, the new trail for this stock is at support under $155.00 area.
The Bottom Line
The same trailing method was applied on different time frames.
Trade well,
#####
For more information on Anka Metcalf and TradeOutLoud, please click here.

