

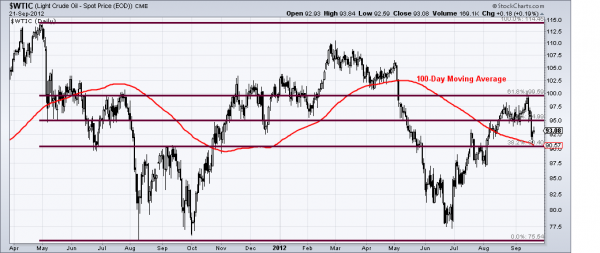
Crude oil is presently at a crossroads with the bulls and bears ready for battle. Almost like clockwork the bears took control of the commodity as it hit the $100/barrel level and as the commentators began to cry about rising gas prices.
Within a few swift days the price of a barrel of WTI crude oil marched back down close to $90 where it came in contact with its 100-day moving average and an important Fibonacci retracement level of $90.40.
CRITICAL JUNCTURE
Some traders will treat these two levels of support as a great buying opportunity while the bears, who appear to still be in control, will likely say they haven’t seen enough blood and set their sights on the previous low of $78/barrel.
CFTC DATA CAN HELP
At junctures like this it can be helpful to turn to COT (Commitment of Traders) data to get a glimpse at how traders are positions in regards to being net long or short. For right now we will focus on the large speculators and commercial traders. As of last week, commercials sit net-short and large speculators sit net-long near the same number of contracts, respectively, as the previous high near $110/barrel.
SMART MONEY
Typically commercials are considered the ‘smart’ money when it comes to COT data, which means if they are still this net-short crude oil after the recent decline then there is a chance the bears could remain in control until the commercials begin to exit their short positions. The previously mentioned support levels will likely be heavily defended by the bulls but it appears the bears have the commercial traders on their side.
Disclaimer: The information contained in this article should not be construed as investment advice, research, or an offer to buy or sell securities. Everything written here is meant for educational and entertainment purposes only. I or my affiliates may hold positions in securities mentioned.
Looking for more trading ideas? Visit our daily Markets section here.

