

Since the peak in June 2013, the price of a barrel of oil has dropped nearly 60% to under $50, and it seems no end is in sight. Supply continues to exceed demand and that is within a decent economic growth pattern. Some analysts predict growth could slow sharply in the year ahead, and that would sap demand for crude even more. Yet, more supply comes online each day as the producers see little reason to cut back on production.
We could point to any number of reasons for why crude has fallen to these low levels, but the increase in crude volatility certainly tells the story. Below we see the chart of the OVX, or the oil volatility index.
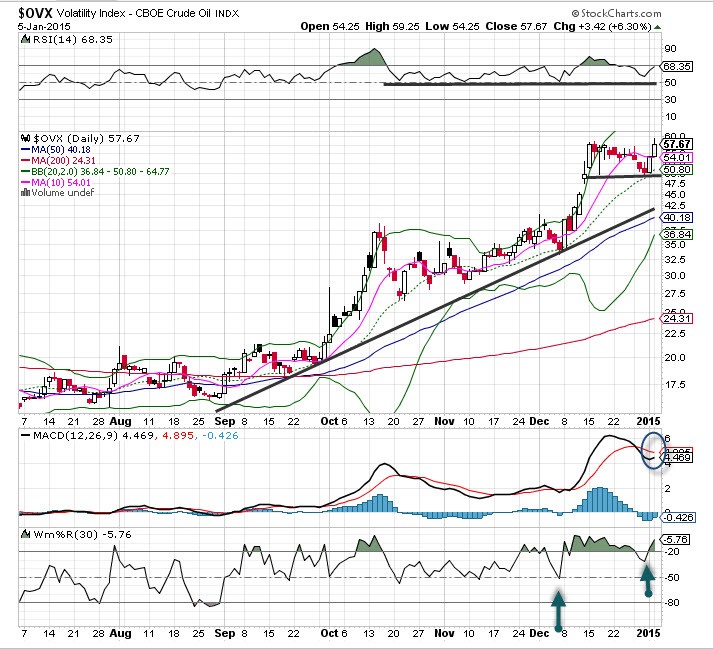
I have been talking about this chart for nearly a month, as the second breakout occurred past 40. What a beautiful trend, a mirror image of the crude price chart. Buying volatility on crude is not easily done. In fact, it really is not practical.
A breakout past 57 clears the path for higher volatility, but as we see the trend line comes in around the 42 level and rising sharply each day. Hence, a test back down would not be a surprise (rise in crude). In fact, the move in oil is off the charts and has stretched well beyond the moving averages.
The best way to get long crude volatility is to buy some short or medium term puts on a vehicle such as USO or other long crude instruments. This approach defines your risk and gives you some exposure to play the downside or to protect some long positions.
To learn more about Lang’s products and services, click here.

