

For the last few years, radio and TV ads have tooted gold’s horn as a safe investment and a hedge against yet another stock market crash. According to one particular commercial, this impending crash is a matter of when, not if.
While gold is often touted as a fear trade, history shows its usefulness seldom extends beyond that of an effective hyperinflation hedge. In a world still warding off deflation threats, I have very little use for gold.
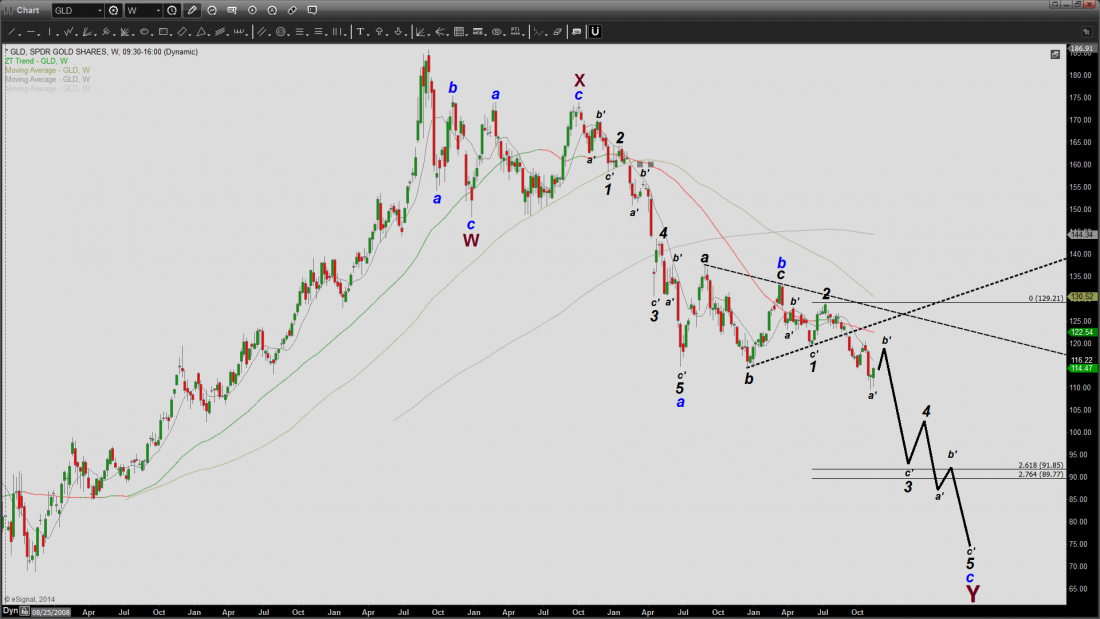
The chart of the GLD (SPDR Gold Trust) below depicts gold’s rise from late 2008 through September 2011.
In light of the allegedly foolish and irresponsible monetary policies (i.e., quantitative easing, money printing, etc.) instituted by the central banks around the world to tame the financial-crisis beast and prevent the imminent collapse of the global financial system, the yellow metal set its sails for seemingly unattainable highs, appreciating by 170 percent in just three short years. The demise of paper currencies was an absolute certainty, according to the likes of Peter Schiff and Marc Faber. Not!
The chart also depicts gold’s misfortune since September 2011. Using Elliott Wave Theory (the Harmonic Elliott Wave model) and chart pattern recognition, price growth in the once “overly precious” metal appears to be defying the 2008-2011 predictions of an unruly, hyperinflationary monetary future.
From a technical analysis viewpoint, the wave progression reveals a double-zigzag corrective pattern with more pain in store. According to this Elliott wave analysis, every inch gained on hyperinflationary presumptions during the 2008-2011 period will be reclaimed.
Currently, the GLD is tracing out blue wave c of larger-degree wave Y. As the chart illustrates, the overall corrective pattern appears to be unfolding as an orderly double zigzag, X-Y-Z, where both wave W and wave Y are the “actionary” components (i.e., moving in the direction of the prevailing trend) and wave X the go-between, reactionary/countertrend rally. Within blue wave c of wave Y, wave b’ of wave 3 appears to be wrapping up some unfinished business, as it could, just could, potentially extend further up towards $121 before wave c’ of wave 3 takes hold with its sights set on a sub-$100 target. Should the price pattern unfold as predicted, wave 4 of wave c of wave Y should retest the $100-$105 area before relinquishing control to final wave 5 that should conclude the 2008-2011 round-trip journey back to the $70’s.
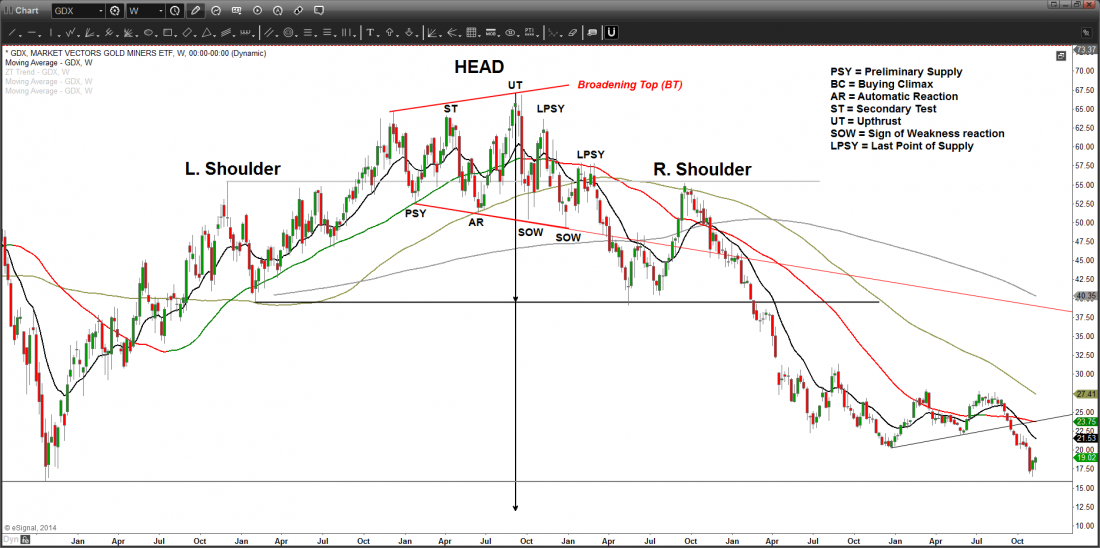
As for the GDX ETF (Market Vectors Gold Miners), the May 2013 chart below conveys my bearish view. If the massive Head and Shoulders formation is any indication, the GDX, currently trading near $26/share, is likely to get cut in half, yet again, before all is said and done.
#####
If you want to learn more about Elliot Wave Theory from Peter Ghostine, please click here.

