

NEAR (2-3 wks) and LONG TERM (2-3 MO+) 2116.00 represents the start of a gradually narrowing range of trend support down to 2114.00 (2122.02 index) able to absorb selling through the balance of the year and above which a secondary long-term buy signal remains in effect, expecting 2221.00 within 3-5 weeks, 2376.50 attainable within 3-5 months. On the other hand, a daily settlement below 2114.00 (rising daily – page 2) indicates a good 2016 high, 2043.25 then considered a 1-2 week target, 1954.25 within 3-5 weeks (possibly sooner) where the market should bottom out through November. Overall, a settlement below 2114.00 would represent significant buy-signal-failure, allowing bearish continuation over the next several months into the 1830.00 region – this potential target essentially confirmed following violation of 1954.25
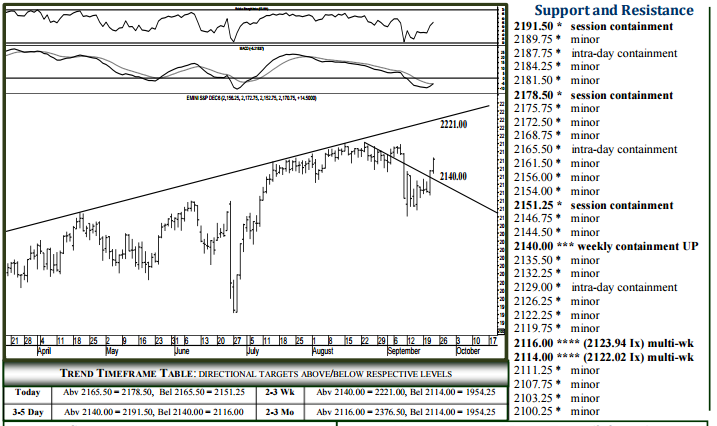
SHORT-TERM (today and 5 days out)
For Friday, 2165.50 should contain initial weakness, above which 2178.50 remains an intraday target able to contain session strength. Pushing/opening above 2178.50 allows 2187.75, possibly 2191.50 intraday, also able to contain session strength and the level to settle above for yielding the targeted 2221.00 trend-line within 3-5 more days. Downside Friday, breaking/opening below 2165.50 signals 2151.25, able to contain session weakness. Breaking 2151.25 allows 2140.00 intraday, able to contain selling through next week and above which 2221.00 remains a 2-3 week target. A surprise settlement today below 2140.00 reverses momentum into next week, a retest of longterm support in the 2114.00-16.00 region then expected within several days.
To receive a two week free trial of the Daily Futures Letters and Monthly Futures Wrap, CLICK HERE

