
Ten Things You Need To Know About Moving Averages
I use moving averages as tools for finding support for resistnace levels in prices on charts. Moving averages work as indictors because they are used by many other market participants…

I use moving averages as tools for finding support for resistnace levels in prices on charts. Moving averages work as indictors because they are used by many other market participants…

Background: Perhaps the simplest to understand and most widely used technical indicator is a moving average, which traders have used for many years to smooth out erratic short-term price fluctuations…

Identifying market tops and bottoms is considered one of the hardest tasks assigned to a trader. However, the market can hint at these momentum shifts if we take the time…
Background: The origination of MACD is generally associated with Gerald Appel in the 1970s, augmented with a histogram added by Thomas Aspray in the mid-1980s. Moving averages reveal the trend…

Hey Traders! It’s me. I get asked quite often to create one of these. Well, here you go! If you want more candlestick insight, check out this video…
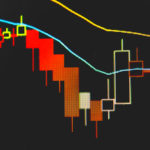
Candlestick charts provide the same information as a bar chart – open, high, low and close prices – but do so in a way that is a more visual depiction…
Experienced traders say the first thing any trader should know about a market is the trend. Trend lines are the basic indicator of trend, of course, but they are quite…

Background: The Donchian Channel method, also known as the 4-week or 20-day rule, was developed by Richard Donchian, one of the pioneers in commodity trend trading with mechanical trading systems.…

Background: The Keltner Bands or channels were developed by Chester Keltner and introduced in his 1960 book, How to Make Money in Commodities. The bands are based on the average…

Directional Movement Index, which with the ADX indicator measures the “trendiness” of a market without regard to whether the trend is up or down. Background: The Directional Movement Index (DMI)…

Background: It isn’t enough to analyze markets when you only look at one static price. Is that price high or low? Does that one price suggest a series of prices…

Traders are obviously interested in prices and how they change over time, but they are equally interested in measuring how fast prices are changing – the momentum of the market.…

Background: The Average True Range indicator was developed by J. Welles Wilder Jr. and introduced in his 1978 book, New Concepts in Technical Trading Systems. This is another measure of…
Background: Relative Strength Index (RSI) is one of several innovative technical indicators introduced by J. Welles Wilder Jr. in his 1978 book, New Concepts in Technical Trading Systems. It was…
This article will take a closer at the the RSI indicator and what certain levels can actually tell us about what we are trading. If you are going to use…
Everyone has their own favorite technical analysis tool – and for me that is no different; I like plotting support and resistance using Fibonacci Retracements. Fibonacci Retracements are key levels using numbers…

A “pivot point” is a price level of significance in technical analysis. A Little Background Pivot points are used by professional traders, market makers and Algos, as a “predictive indicator”…
