
How To Locate Trades: Trading Market Structure
Markets put in key levels of support and resistance, which can then be traded if the market revisits the area and the price and volume action are right. We have…

Markets put in key levels of support and resistance, which can then be traded if the market revisits the area and the price and volume action are right. We have…

I was in junior high school the first time I was introduced to Market Profile. My Dad was a grain trader and the hedge manager for Ralston Purina, a huge…
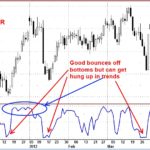
Background: %R was developed by well-known trader Larry Williams in the 1970s as a variation of stochastics. Instead of relating the latest close to the lowest low during a specified…

There are a few different ways to analyze market breadth, a measure of health which identifies the number of stocks rising versus falling. Intuitively, we know that if more stocks…
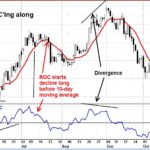
Background: The Rate of Change indicator is another view that looks just like the Momentum Indicator on a chart. Most of the comments for the Momentum Indicator also apply to…
Volatility measures the relative rate and extent that the price of a mark moves up or down. If the price of a market moves up and down wildly over a…
We’ve been blessed with Bollinger Bands® since John Bollinger created them in the 1980’s. Now, many a trader uses Bollinger bands in a variety of ways, each seeking their way…
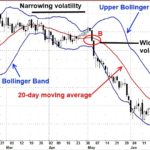
Background: The Bollinger Band® indicator was developed by John Bollinger in the 1980s as a specialized adaptation of trading envelopes or bands to gauge how high or low prices are…
Background: The Chaikin Volatility indicator is one of a number of indicators developed by Marc Chaikin. It quantifies volatility as a widening of the range between the high and the…

Trying to make your way in this very tough market is nearly impossible without the right guide. Imagine trying to find a new destination without a road map (or gps…
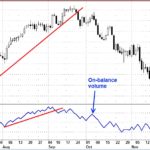
Background: The vertical bars showing volume on the bottom of price charts provides a quick visual picture of how market activity is quantifying buying and selling pressure, but raw volume…
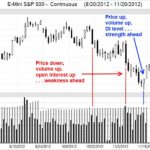
Background: By themselves, volume and open interest data may not be that valuable aside from indicating the liquidity of a market. But, used in conjunction with price action, these numbers…
One of the faults that some traders find with technical indicators is that most of them are based on the same thing – price and various manipulations of prices. However,…

The 3 by 3 is a proprietary trading technical tool that I developed in the early 1990’s. The purpose of the 3 by 3 is to find meaningful support and…
