

TRIANGLES (3-3-3-3-3)
The triangle pattern contains five overlapping waves that subdivide 3-3-3-3-3 and are labeled A-B-C-D-E. Triangles are delineated by connecting the termination points of waves A and C, and B and D. Wave E can undershoot or overshoot the A-C line but cannot pass the termination point of Wave C. Most of the subwaves in a triangle are zigzags, but sometimes one of the subwaves (usually wave C) is more complex than the others and can take the shape of a multiple zigzag, also one of the sub-waves (usually wave E) is itself a small triangle, so that the entire pattern protracts into nine waves.
A triangle always occurs in a position prior to the final actionary wave in the pattern of one larger degree, i.e., as wave four in an impulse, wave B in an A-B-C, or the final wave X in a double or triple zigzag or combination (discussed in section 4. below). A triangle may also occur as the final actionary pattern in a corrective combination, Wave Y (in a double) or Z (in a Triple) as discussed in section 4.
There are three varieties of triangles: Contracting, Barrier and Expanding, as illustrated in Figure 3.1
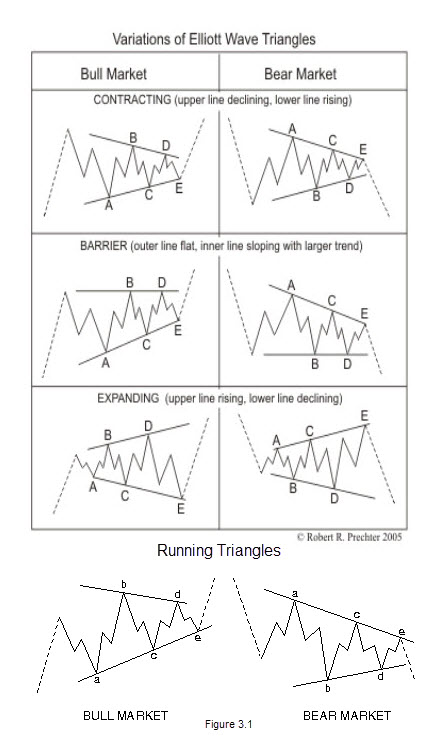
The top of Figure 3.1 depicts Contracting and Barrier triangles as taking place entirely within the area of preceding price action, which may be termed a regular triangle. However, it is extremely common for wave B of a contracting triangle to exceed the start of wave A in what may be termed a running triangle, as shown in bottom of Figure 3.1. Despite their sideways appearance, all triangles, including running triangles, must make a net retracement of the preceding wave at wave E’s end.
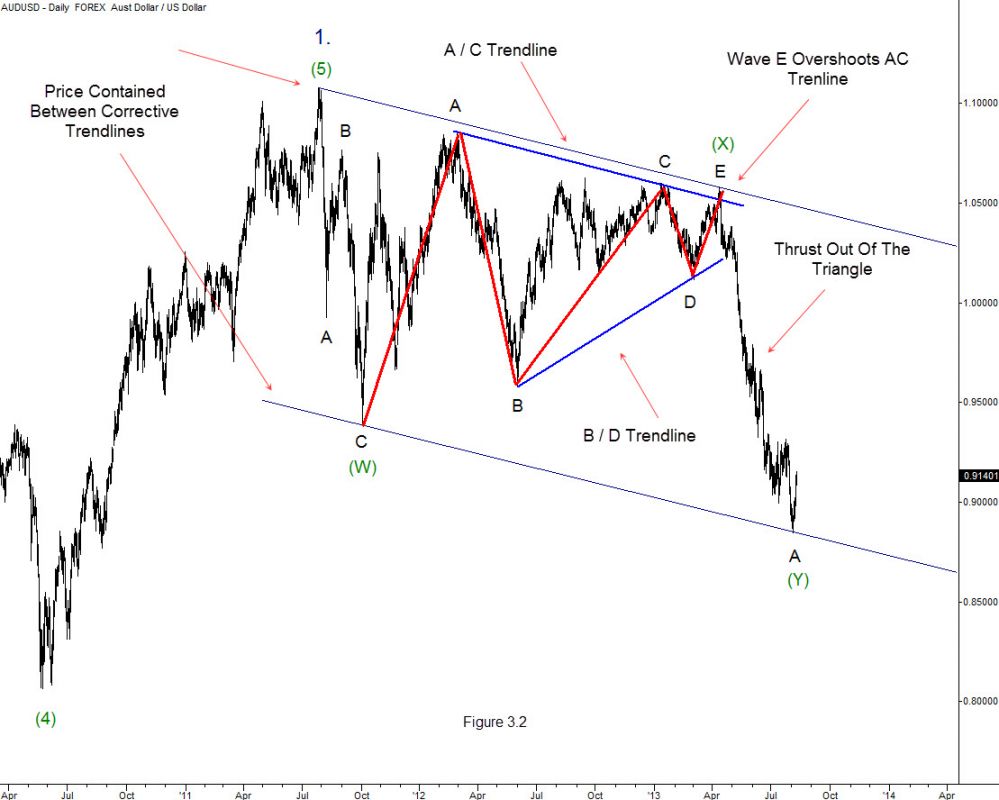
In the stock market, when a triangle occurs in the fourth wave position, wave five is sometimes swift and travels approximately the distance of the widest part of the triangle. Elliott used the word “thrust” in referring to this swift, short motive wave following a triangle. The real life example shown in Figure 3.2 shows a completed contracting triangle in the (X) wave position . In powerful markets, there is no thrust, but instead a prolonged final wave just like theAUDUSD example shown here.
COMBINATIONS (DOUBLE AND TRIPLE THREES)
Elliott called sideways combinations of corrective patterns “double threes” and “triple threes.” While a single three is any zigzag or flat, a triangle is an allowable final component of such combinations and in this context is called a “three.” A double or triple three is a combination of simpler types of corrections, comprising of the various types of zigzags, flats and triangles covered above. Their occurrence appears to be the flat correction’s way of extending sideways action. As with double and triple zigzags, each simple corrective pattern is labeled W, Y and Z. The reactionary waves, labeled X, can take the shape of any corrective pattern but are most commonly zigzags. As with multiple zigzags, three patterns appear to be the limit, and even those are rare compared to the more common double three.
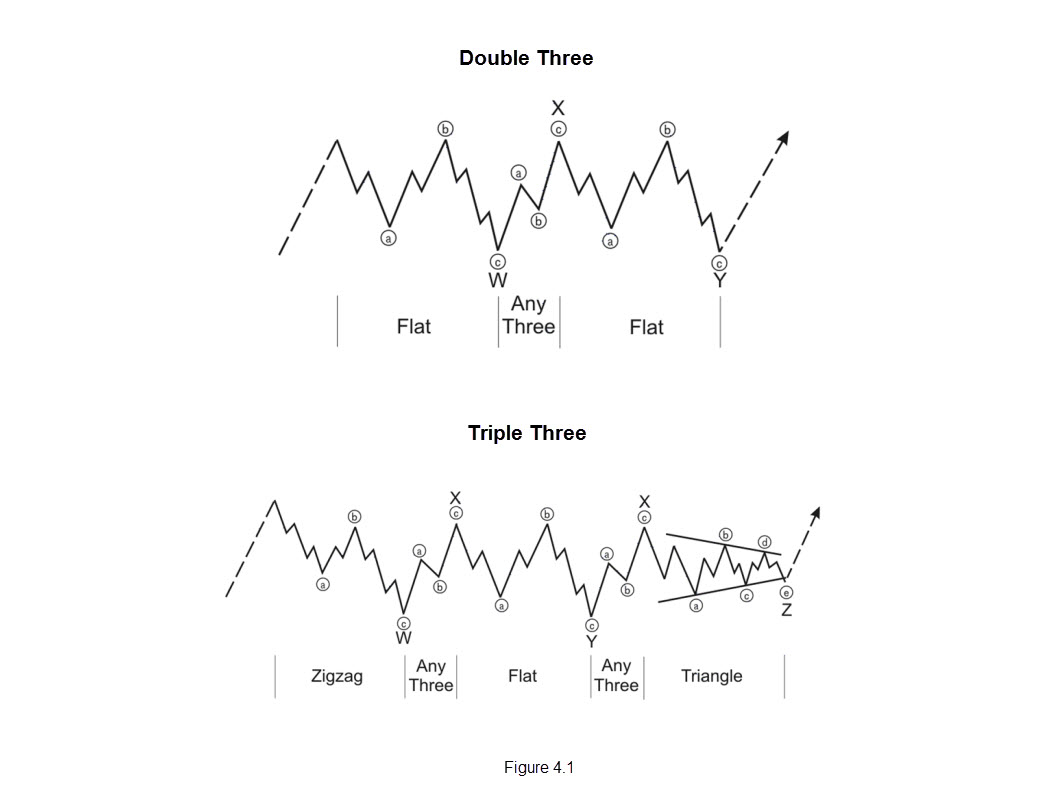
For the most part, double threes and triple threes are horizontal in character. One reason for this trait is that there is never more than one zigzag in a combination. Neither is there more than one triangle. Recall that triangles occurring alone precede the final movement of a larger trend. Combinations appear to recognize this character and sport triangles only as the final wave in a double or triple three.
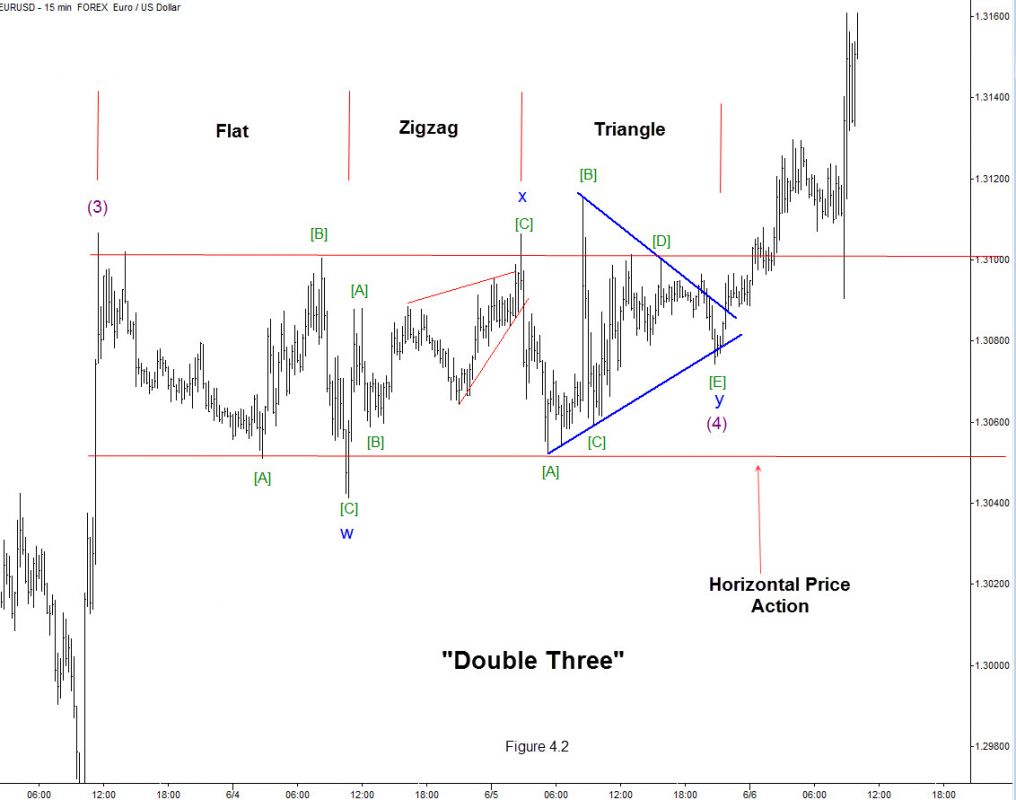
In a double or triple zigzag, the first zigzag is rarely large enough to constitute an adequate price correction of the preceding wave. The doubling or tripling of the initial form is typically necessary to create an adequately sized price retracement. In a combination, however, the first simple pattern often constitutes an adequate price correction. The doubling or tripling appears to occur mainly to extend the duration of the corrective process after price targets have been substantially met. Sometimes additional time is needed to reach a channel line or achieve a stronger kinship with the other correction in an impulse wave. Figure 4.2 is a recent example of a double three correction on a 15 minute chart in euro/dollar (EUR/USD).
ANALYST TIP
While impulse waves have a total count of 5, with extensions leading to 9, 13 or 17 waves, and so on, corrective waves have a count of 3, with combinations leading to 7 or 11 waves, and so on. Therefore, if an internal count is unclear, the analyst can sometimes reach a reasonable conclusion merely by counting waves. A count of 9, 13 or 17 with few overlaps, for instance, is likely motive, while a count of 7, 11 or 15 with numerous overlaps is likely corrective. The main exceptions are diagonal triangles of both types, which are hybrids of motive and corrective forces.
All the patterns illustrated here take the same form whether within a larger rising or falling trend. In a falling trend, they are simply inverted.
#####
For specific trading ideas and current thoughts, check out Markets On The Move .

