

Yesterday
Well, we said it would be choppy.
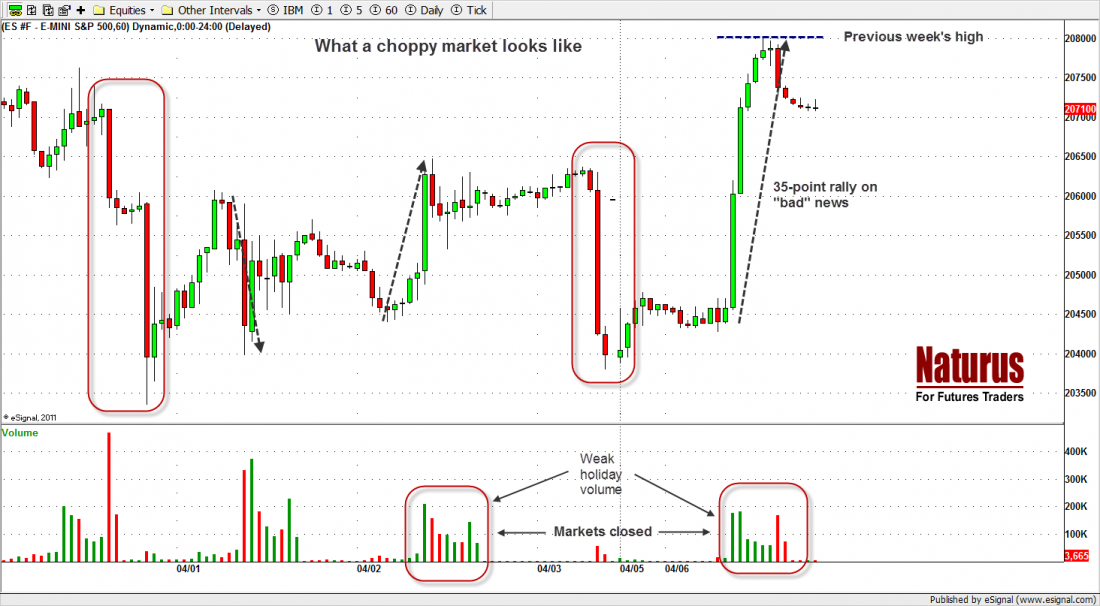
The S&P 500 mini futures (ESM5) closed at 2073.25 Monday (Apr. 6) after a wild buying spree that pushed the price up about 35 points in the morning session, before falling back a little for the close. It was the biggest open-to-close bump since last November.
The trading since the market closed for Good Friday has been a classic example of everybody running to the same side of the bed … and then back again (See chart.). After frantic selling following the dismal Non-Farm payrolls report released Friday morning, despite the holiday, the futures dropped 25 points in Globex trading over the weekend.
Then, when the markets opened Monday morning, the bad news – crummy employment numbers – suddenly became good news, based on the Street’s speculation that it might be bad enough to deter the Fed from raising rates. The market recouped all of the losses and ran back to last week’s high, where it stalled. Not to put too fine a point on it, but this market is nuts
Today
The futures generated strong momentum when they breezed through the resistance at 2065 yesterday. Today, we need to see some follow-through to demonstrate that this is not just the machines pushing the price around when the trading desks are only half manned. If we don’t see some persistence, we could be looking at a crash back down to the weekend’s Globex lows around 2040.
The 2065-62 zone is still a key area and should be watched very carefully this week. Remaining above that level – say a retracement to that point and then a bounce – might be enough to persuade the Bears to give it up, which could push the price back up to yesterday’s high around 2080-82 or higher up to 2092.75-95.50 (short entry).
A failure to hold above the 2062 level followed by a break below 2059.50 could lead to a strong sell-off toward the 2050-46 zone (long entry) or lower.
There is not much fundamental change from last week to this week. About the only change is in the Street’s perception of what the Fed is planning. In two words … pure speculation.
- Major support levels: 2045-43.25, 2035.50-33.50, 2028-29, 2015.50-14.50
- Major resistance levels: 2082.50-79.50, 2088.75-89.50, 2096-98.50
ESM5 Intra-day Chart — 60-minute bars. Apr. 6, 2015
#####
Naturus.com publishes a free weekly analysis of US equity indices. To get on the mailing list to receive it, please click here.

