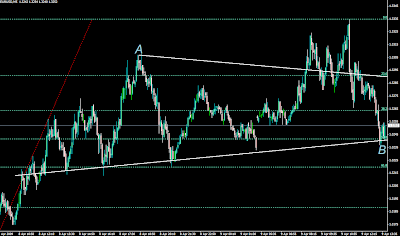
So, it´s seems to come down, this is the chart which leaves still some room to the upside, 50% is pretty meaningfull support area to retrace together with that line chart, propably some sideways trading inside of there or least least retracement bounce – at the very end of the day I would not call this upside impulse instead something much more complex.
60 minutes chart is shorting, as well as 30 minutes chart. 15 and 5 minutes charts starts to approach oversold levels now.
Once and if this lower line is broken, it´s new impulse down, at so far it´s still just zigzag. All triangles tends to run very narrow end before any breake.


