

The Euro Stoxx 50 has climbed to the area we mentioned in our July post
, where resistance might come in to drive the index to a new low. If the resistance works as we expect, then the next decline should be fairly powerful.
Although there is more than one possible Elliott wave interpretation of the long-term chart pattern, one of the common features of our leading scenarios is that the rise in the index from 2009 has the appearance of a three-wave corrective move. Several factors reinforce that interpretation, including the fact that price momentum on a monthly time frame has moved into negative territory during 2016.
Viewing the climb from 2009 to 2015 as corrective suggests some ideas of what to expect in early 2017. Specifically, if the index manages to form a lower high soon, then the next downward move should have the role of a third wave or a ‘C’ wave – i.e., a segment in a chart pattern that typically moves price farther than most swings do.
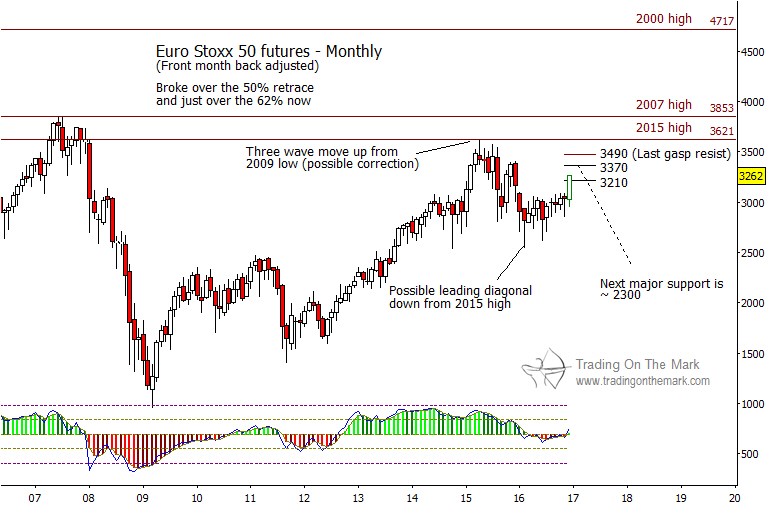
At present, we are viewing the climb to the current area as an upward retracement of the initial decline from the 2015 high. Consistent with this view, the initial decline counts fairly well as a leading diagonal pattern. Typical Fibonacci resistance levels in futures price include 3210 and 3370, while 3490 is probably the highest that the move should go while still being called a retracement.
If a decline begins from nearby, then the next big-picture target should be near the 2300 area.
Take advantage of our December subscription discount for new subscribers! This month, we’re offering a 20% discount for all new subscriptions taken for our daily analysis service, which includes regular updates for the S&P 500, crude oil, the Dollar and other currencies, precious metals, bonds, and more. If you sign up for a longer subscription period – 3 months or 6 months – the discount makes your savings even greater. Just follow this link and use the coupon code 4CCF7 to claim your discount.

