It is actually reasonable simple chart by EW point of view. Downside movement is ABC movement where both, A and C breakes for similiar size impulse waves and B in the middle just terminates it where waves were changed.
Monthly chart 50 % retracemed once was reached turned up and there is pretty clear one full impulse wave up and finished, as next it is retraced 50% and started to roll up again.
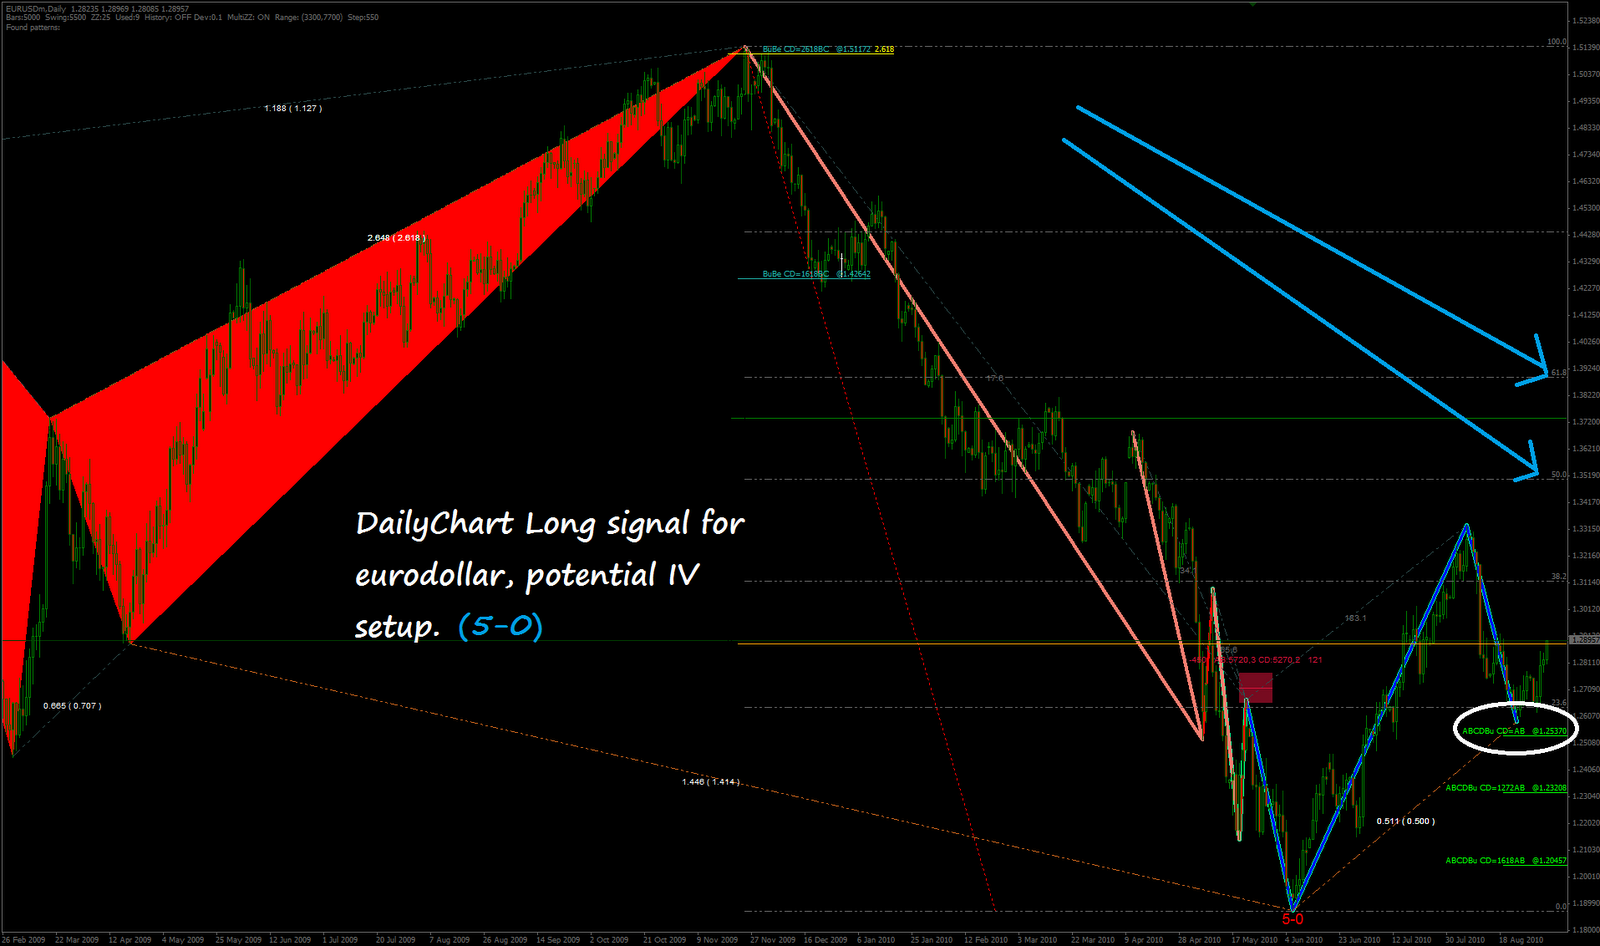
5-0 is IV wave and with minium it should open B wave up. When and once this first cirmunstances is met exactly the same 50% and 61.8% offers small resistance for this small impulse and it is possible it is going to drop C down which would place in fact very bullish scenario because market would consider that to be W2. It is possible this kind of movement is coming on next week once upside B wave cirmustances are met.
But larger degree as attatched daily chart shows where the real power is likely placed, it is on the way higher by then, behaviour is exactly the same as explained above for smaller timeframe.