

“The probability of an event is greater or less, according to the number of chances by which it may happen, compared with the whole number of chances by which it may either happen or fail.” De Moivre, Doctrine of chances.
If only trading were that easy.
Well, theoretically, it sort of is. But the difference between knowing a coin will land on heads an average of 50% of the time and knowing which way and for how long a currency pair will go in one direction is in the difference in unknown variables between the two. In other words, we can never know all the inputs that go into a currency movement.
DANGERS IN OVER-TRADING
I wanted to take a break from talking about movement in the euro to discuss the dangers in over-trading multiple pairs. Below – on the right is the daily euro graph we’ve been looking at. We’ve been respecting the levels I’ve been discussing. Obviously, the 200-day moving average (MA) is still support, that bull flag didn’t give us new highs yet, but nor did it turn into a full-fledged down trend (yet).
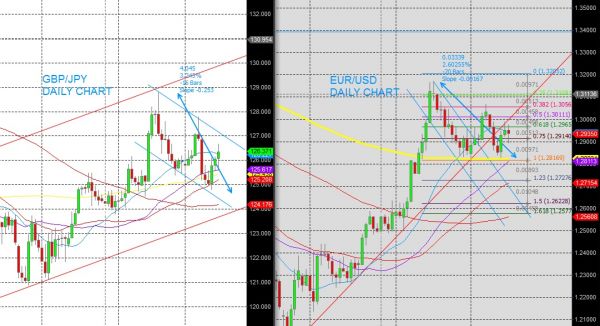
On the left is a pair whose movements the new trader would probably think is completely unrelated to the price action on the euro.
EVERYTHING IS INTER-CONNECTED
However, all markets are connected and move together in proportion to the extent of that connection. And the Euro versus the Dollar moves in correlation with the Pound versus the Yen. There are all sorts of reasons for this beyond the scope of this article.
USE THE CORRELATION
There are a few ways to use this connection. One wrong way is to over-leverage in a correlated move. Say you had 3% risk long the euro at those highs (because we shouldn’t fight the trend) and another 3% risk on the same day (September 19) going long the sterling/yen (GBP/JPY). Essentially, this is the same trade. I prefer being wrong once to being wrong twice.
One positive way to use this correlation is in finding movement. Both pairs have been consolidating since that peak high. Both have given opportunities for pips. Both are respecting technical levels. But, putting a measuring tape on this most recent consolidation, we find that the GBP/JPY has had a 3.25% change while the euro has had a 2.60% change. That’s almost a 50% difference in movement (using the euro move as a baseline). Compound that with the price of a pip between the two pairs, and obvious difference in volatility within these respective consolidation patterns and things can add up quickly. Or if you’re wrong on both pairs, it can really hurt.
The other danger is things tend to correlate until they don’t. So be careful if you’re going to play with these differences in probability.
= = =

