

We’ve spent the last several weeks developing the Lindsay forecast for an end to the 2009 bull market. The great thing about Lindsay is that there is more than one way to get to an answer. Every method I have shared so far has had one thing in common; they were all moving forward in time to forecast the top of the market. This week I want to introduce a method to help forecast the top by moving backwards in time.
INTERVALS
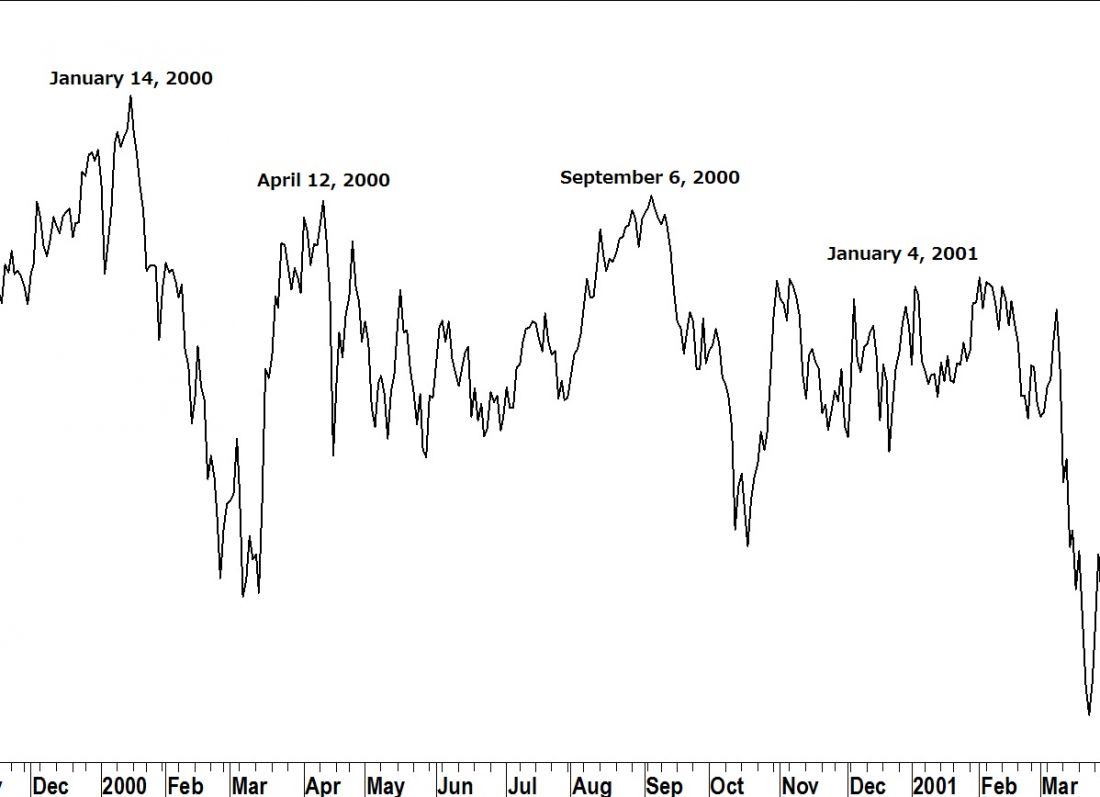
In my January 14, 2013 article I introduced the 12-year interval. This interval, taken from an important high and counting forward to a time period 12-years, 2months to 12years, 8months in the future, is the first step in identifying lows. These lows may be bear market lows or they may be tradable lows (the subject of a future article).
THERE IS OVERLAP
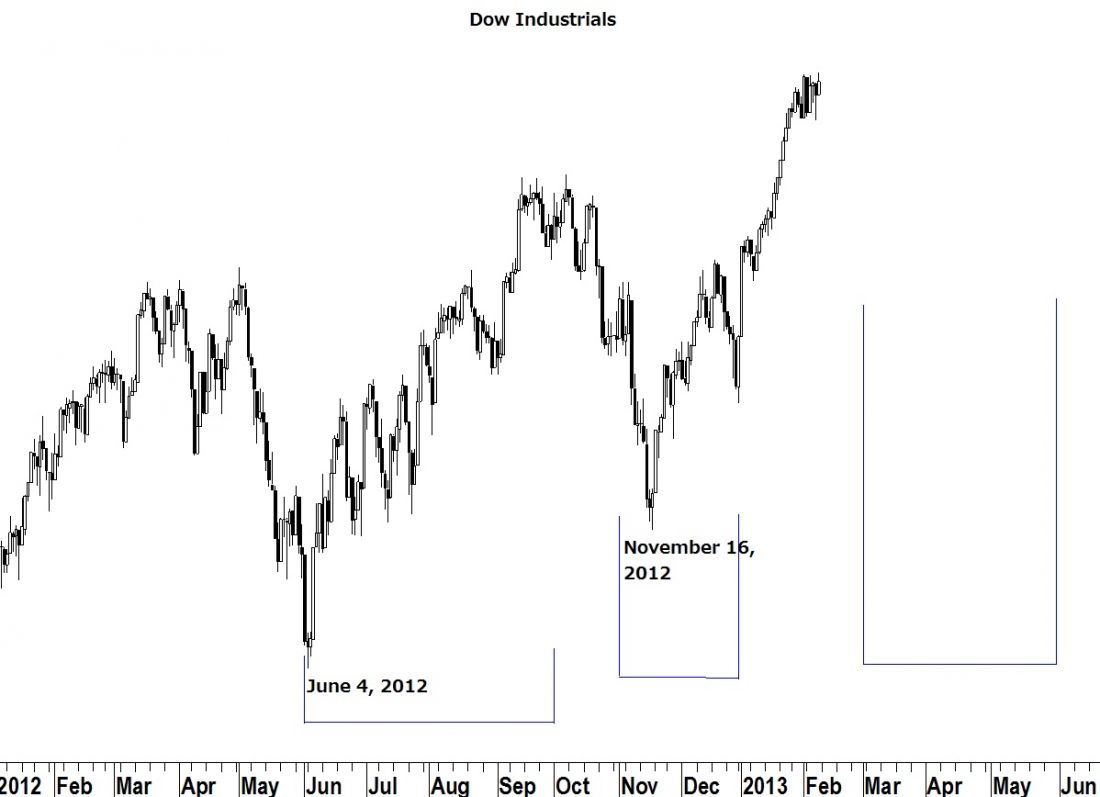
Often these six-month time periods overlap one another. Counting 12-year intervals from the highs in January and April 2000 pointed to lows in the time periods March-September 2012 and June-December 2012. The two periods overlapped between June and September 2012. The 6/4/12 low fell in that time frame.
Counting a 12-year interval from the high in September 2000 pointed to a low in the time period from November 2012 to May 2013. It overlapped the interval counted from April 2000 in the period between November and December 2012. The 11/16/12 low fell in that time frame.
LOOKING AHEAD
The next 12-year interval counts from January 2001 and points to a low during the period March -September 2013. It overlaps the September 2000 12-year interval in the period between March and May 2013. We can expect to see a market low of some degree during this time period. And if a low is coming, unless the laws of physics have been changed, a market high will need to be observed first.
[Editor’s note:
If you would like a free copy of Carlson’s February Lindsay Report, contact him via his website. ]
= = =

