
We’re seeing a bit of fear and profit-taking in early July in the equity and commodity markets after a strong second-quarter performance. Remember the adage: “sell in May and go away?” Perhaps this year we are getting a delay. Let’s take a look at what July might have in store for some of the major markets, and possible trading strategies.
In the second quarter, the “green shoots” were starting to develop in the economy, and stocks and commodities were the beneficiaries. The S&P 500 ended the quarter up 15.2 percent, its best quarterly performance since 1992. The U.S. dollar fell 5.5 percent in value, and most commodities saw bullish trends. The Dow Jones-UBS Commodity Index, which represents a basket of 19 commodities, finished 12 percent higher for the quarter. Among individual commodities, crude oil saw a 41 percent rally, the biggest quarterly gain since 1990. Copper rallied 23 percent and was up 62 percent on the year. Sugar hit a three-year high the last trading day in June, and is up about 50 percent on the year.
Risk-aversion was easing in the second-quarter, prompting investors to dive into stocks and commodities. However, at this time last month, I felt some of these markets, mainly the S&P 500 and crude oil, had gotten a little ahead of themselves and needed to correct a bit.
Then we got something shocking before the 4th of July holiday that dampened buyers’ enthusiasm and prompted a pullback–a gloomy June unemployment report. The report sent shockwaves through the markets. Non-farm payrolls fell 467,000 (more than expected), and the unemployment rate rose to 9.5 percent.
U.S. Dollar and Yen
The dollar was in a bearish trend in the second quarter. As the dollar tends to trade inversely to commodities, which are priced in dollars, it was a driving force behind commodity moves. I think it will remain so in July. The ICE U.S. Dollar Index futures contract, which represents the dollar’s standing against a basket of six global currencies, was basically in a trading pattern in June, consolidating off its prior downturn during the quarter. We are now seeing some signs of strength in the dollar and also the yen, currencies investors turn to as safe-haven plays. The yen moved up four days in a row after the employment report, from about $1.03 up to $1.09, representing a flight to quality. Investors have recently been buying the yen and dumping risky assets. We saw a similar move in the dollar, although not quite as strong as in the yen.
If the stock market continues its early bearish trend this month, the dollar should continue to rally. I’d look for two closes above 82 or 82.50 in the September U.S. Dollar Index futures as positive for the dollar, but longer-term, I’m more bearish than bullish on the dollar’s prospects. I don’t think we’ll see the type of fear and panic we felt earlier in the year. The green shoots haven’t died.
Manufacturing data represent one of those green shoots. The Institute of Supply Management’s Manufacturing index was at a 28-year low in December, then rose for six straight months to hit 48 in June. While a number below 50 in this index typically means we are in contraction mode, it has showed positive signs, and had even jumped above 50 In May.
Housing, as dismal as it has been, has also shown signs of improvement. There have been fewer foreclosures, and pending sales of existing homes rose for a fourth month in May. More of these green shoots should help calm investor fears after the weak employment report.
S&P 500
I thought the S&P 500 might hit 1,000 last month before correcting, but it didn’t quite get that far. Looking at a chart of the S&P 500, we can clearly see what happened when the employment report was released on July 2. I have been looking for a correction to 840 or even 780 in the September S&P futures, and still see that as a target this month.
Longer-term, the chart shows a possible head-and-shoulders bottom. So what I see for July and into August is a consolidation period, then a march higher in the fourth quarter. Right now, we are seeing bottoming action. Was the non-farm payrolls number so vicious that it changed everything we were optimistic about before? No. Did it kill all the green shoots? No. It just showed the market was overbought. However, I think the payrolls paranoia was also overdone. Keep in mind, we have quarterly earnings season approaching for stocks, and it could get choppy. But overall, I think earnings will beat the street more often than not and that should prevent the major stock indexes from retesting the year’s lows.
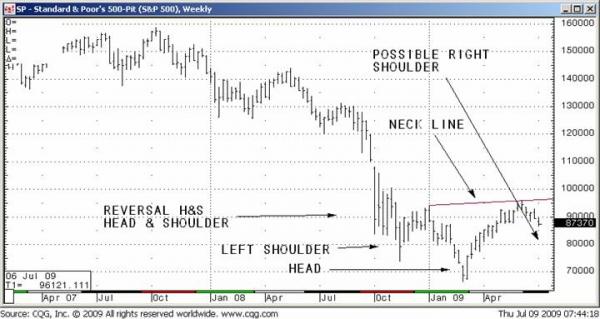
If the S&P can rally to 892 to 900 this month, I’d be looking to sell September S&P futures with a stop at 906 – 907. I’m not sure we’ll have enough momentum to power the market up much at this time of year, when volume tends to be light. But on a move under 840, I’d be looking for opportunities to buy, and watch for a completion of the bullish longer-term head-and-shoulders pattern.
We’re seeing some vicious selling after a whole lot of window-dressing at the end of the quarter. I expect the S&P could see a range of 825 – 900 for the month. In sum, the psychology changed a bit in stocks in early July, but the market was overbought and I think the correction is healthy.
Energy and Metals
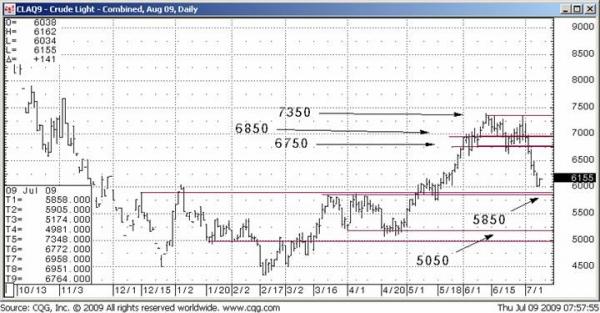
Many commodities were also getting overbought last month. Crude oil rose above $73 a barrel in June and held up fairly well during the month. But when it finally broke, it broke hard. If the S&P 500 falls to 880 or 800, crude oil could go to $50. This month, I would recommend selling rallies in August crude oil to around $65.50, with a stop at $68. I wouldn’t risk too much on the short side, as I don’t think crude oil will collapse. A close over $69 would nullify the downtrend and should bring a bounce back toward the highs.
Gold is in a downtrend on a short-term chart, but longer-term chart shows a more bullish picture. I see support at $870 – $880 an ounce and recommend trying to buy gold on dips to these levels, with a stop around $840. If the stock market corrects and investors start to get spooked, I think gold will likely recapture its safe-haven status.
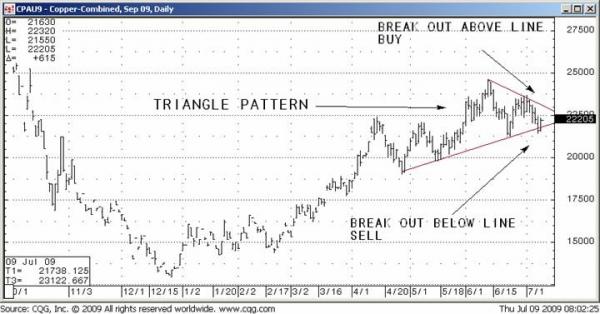
Copper is a good barometer of the economy, as it is used in housing and industry. China has been stockpiling copper, driving the market higher in the second quarter. Copper has pulled back in recent days, declining nearly 3 percent since the July 4 holiday.
On the daily chart of copper, I see a possible head-and-shoulders pattern forming. If China doesn’t come in and support the market, COMEX copper futures could see a decline down to $2.00 or $1.90 a pound, which isn’t that far away from where the market is at now. A close under $2.10 and we should head to $1.90. I’m slightly bearish copper in July, as I am on the stock market, but an economic revival should be bullish for copper in the months ahead.
Grains
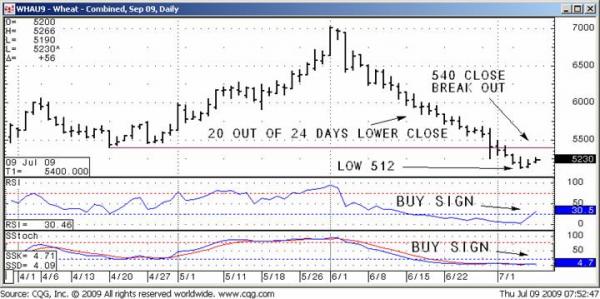
On the agricultural side, we are heading into perhaps the most important period of the growing season and these markets will be interesting to watch. In contrast to some other commodities, wheat has been in a bearish pattern in June. Without taking fundamentals into consideration, the daily chart of wheat futures shows a very oversold picture; the Relative Strength Index (RSI) is showing a mild buy signal. Since June 3, we’ve had four of about 28 days showing bearish candlestick formations. As far as a trading strategy, I’d recommend buying on a close over $5.20 or $5.40, and I’d recommend putting a stop under $5 ($4.99).
Keep in mind when looking at seasonal tendencies in any market, there are usually underlying fundamental circumstances that cause futures to move in a certain directional manner at certain times of the year. Keep in mind that when you are considering trading markets affected by seasonal trends, these factors are generally already reflected in market prices. So if you are trying to trade based on a certain seasonal trend or tendency, you have to strategize based on “noise” within the trend, or unexpected shocks that may not be priced in. Maybe you think conditions are different this year. You might have to enter or exit a trade earlier or later to catch the trend. As always, good money management skills are paramount.
Overall I think the theme for the month is likely to be one of risk-aversion, but also of summer doldrums. We aren’t likely to see enough volume to really push the markets to new heights. That might have to wait until the fourth quarter.
These are just a few of my thoughts and ideas for the month of July. Please feel free to call me to discuss these or other markets, and to incorporate specific trading strategies for your account size and risk tolerance. Good luck and good trading!
Jeff Friedman is a Senior Market Strategist with Lind Plus. He can be reached at 866-231-7811 or via email at jfriedman@lind-waldock.com. You can also follow Jeff on Twitter at www.twitter.com/LWJfriedman. Join Jeff for his monthly webinar, Friedman’s Futures Forecast, by visiting Lind-Waldock’s events page. You can view an archived webinar of this forecast at www.lind-waldock.com/events, where Jeff covers even more detail.
Past performance is not necessarily indicative of future trading results. Trading advice is based on information taken from trade and statistical services and other sources which Lind-Waldock believes are reliable. We do not guarantee that such information is accurate or complete and it should not be relied upon as such. Trading advice reflects our good faith judgment at a specific time and is subject to change without notice. There is no guarantee that the advice we give will result in profitable trades. All trading decisions will be made by the account holder.
Futures trading involves substantial risk of loss and is not suitable for all investors. 2009 MF Global Ltd. All Rights Reserved. Futures Brokers, Commodity Brokers and Online Futures Trading. 141 West Jackson Boulevard, Suite 1400-A, Chicago, IL 60604.

