

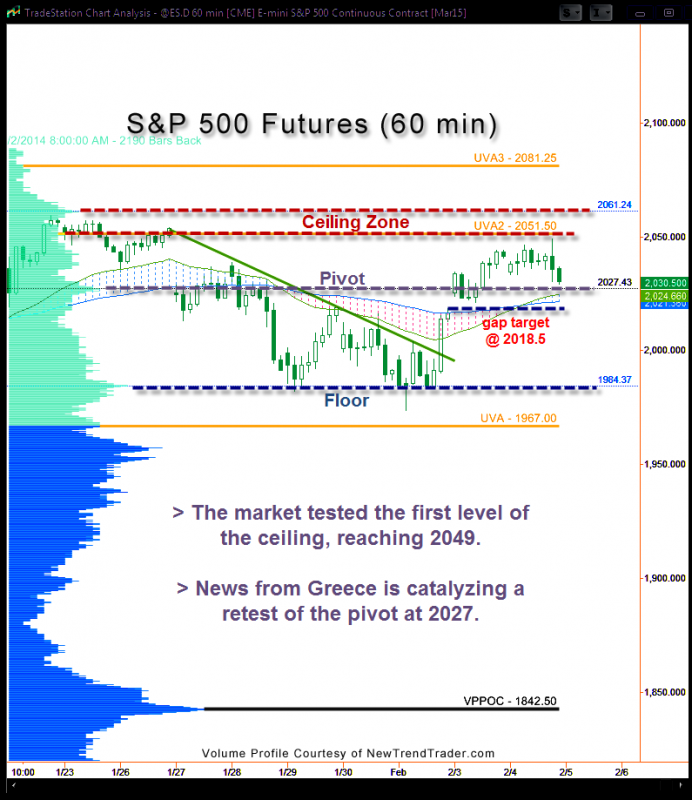
Both forecasts from yesterday played out. First, the S&P came within two points of the ceiling zone at 2051. Then, news from the ECB sparked an end-of-day sell off, triggering the expected re-test of the 2027 level, which is now underway.
Yesterday
- The presumption is that we now go up to test the 2051-2061 level from below.
- However, a second test of 2027 before attempting that major assault would not be at all surprising.
Today
- A gap beckons at 2018.50. A timely fill of that gap would represent good housekeeping on the part of the bulls.
A Note on Volume Profile
The histogram on the left side of the chart shows the volume distribution in the S&P futures for the entire year of 2014 through today. Key levels are indicated by the peaks and troughs.
If you would like to receive a primer on using Volume Profile, please click here.

